Core Connections Course 1 Student 1st Edition Chapter 2 Arithmetic Strategies and Area
Core Connections Course 1 Student 1st Edition Chapter 2 Closure Exercise solutions Page 91 Problem 1 Answer
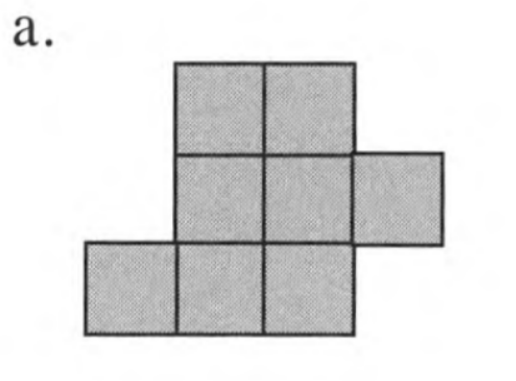
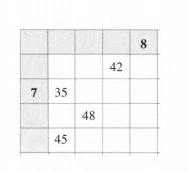
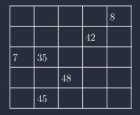
The given figure is
It is required to fill up the blanks.
We will fill-up the blanks according to the property of the multiplication table puzzle.
You might be able to notice (and remember) the multiples by looking for patterns in the numbers that make up the times table in question.
Read and learn More Core Connections Course 1 Student 1st Edition Solutions
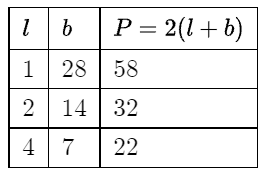
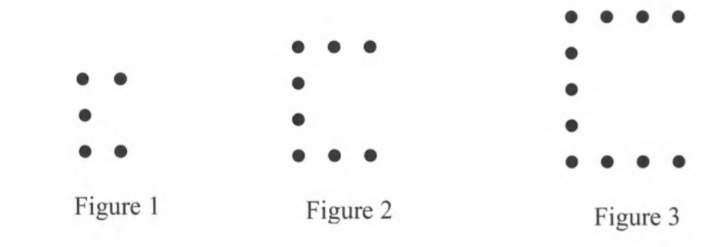
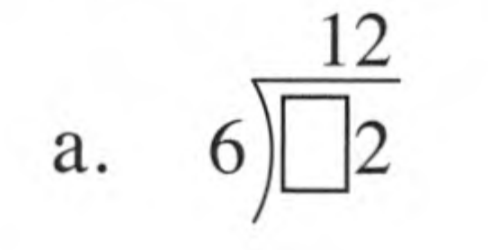
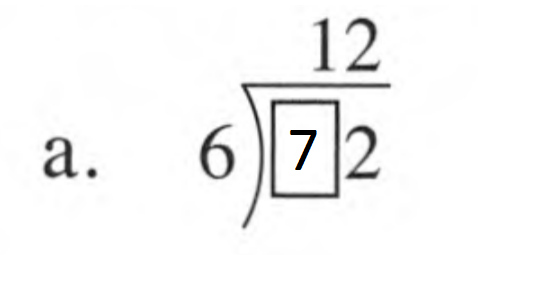
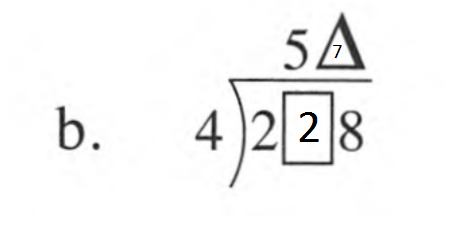
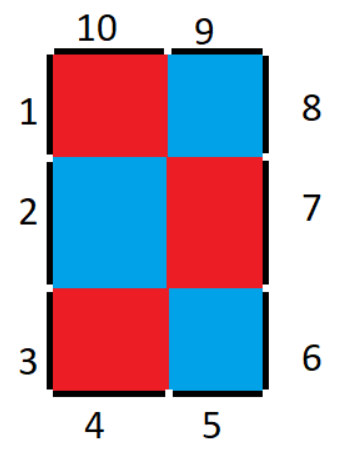
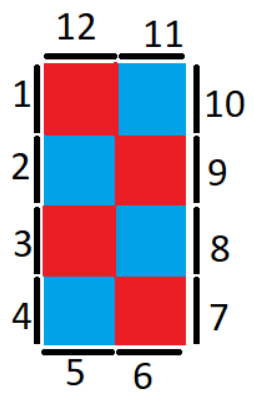
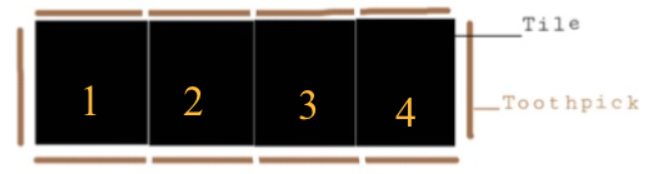
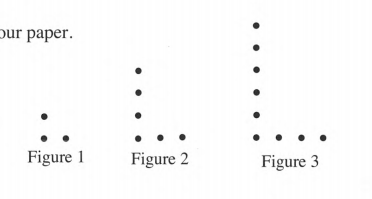
Aruni found an incomplete multiplication table puzzle as shown below.
We start by third row with numbers 7 and 35.
Since five times 7 is 35, we can find out the remaining numbers in that row
7×6=42,7×7=49 and 7×8=56
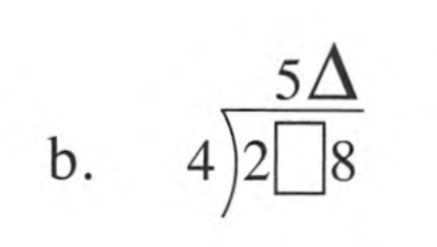
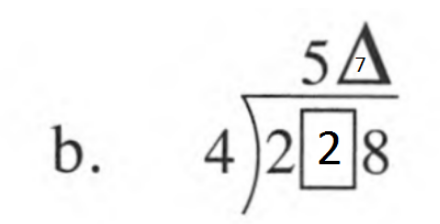
Now using fourth column with numbers 42 and 49 whose common factor is only 7 which will come on the top.
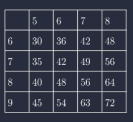
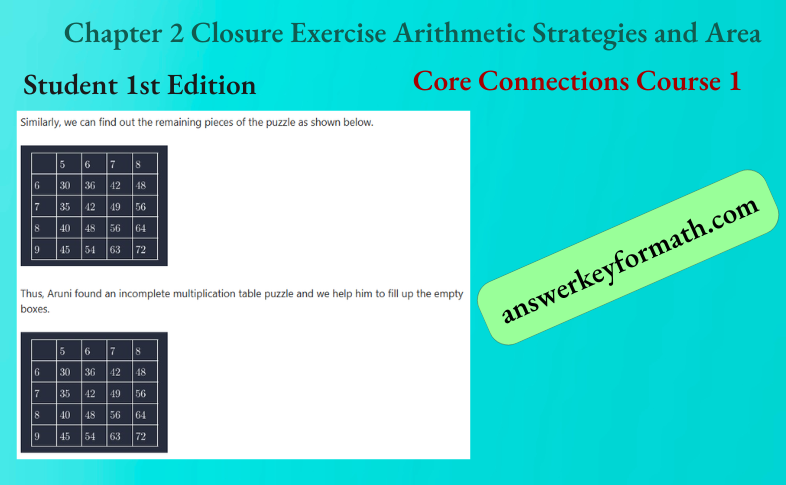
Similarly, we can find out the remaining pieces of the puzzle as shown below.
Now using fourth column with numbers 42 and 49 whose common factor is only 7 which will come on the top.
Similarly, we can find out the remaining pieces of the puzzle as shown below.
Core Connections Course 1 Student 1st Edition Chapter 2 Closure Exercise solutions Page 91 Problem 2 Answer
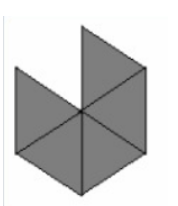
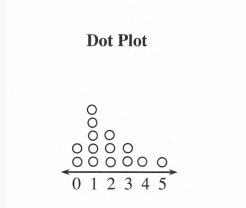
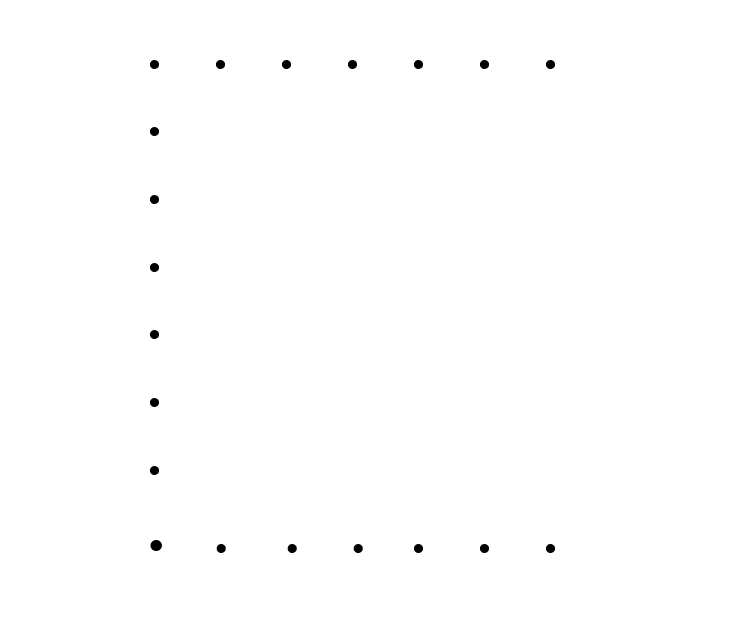
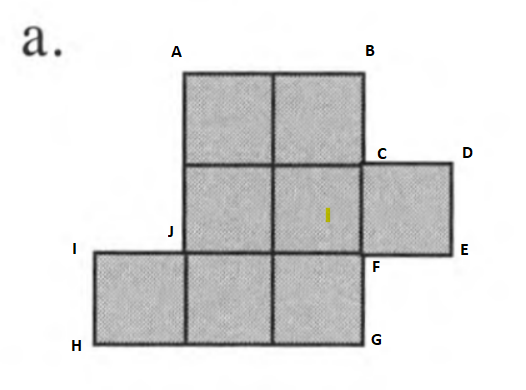
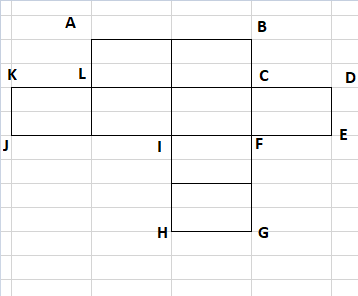
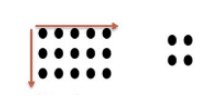
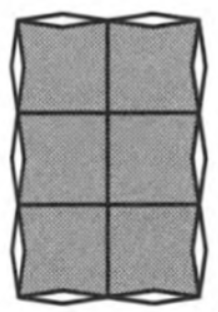
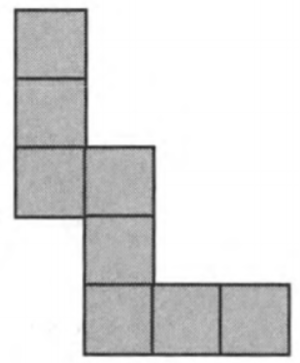
The given figure is
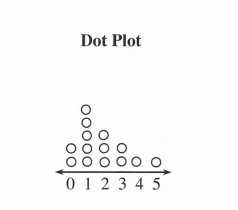
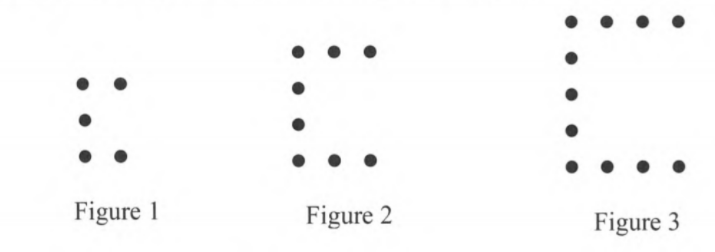
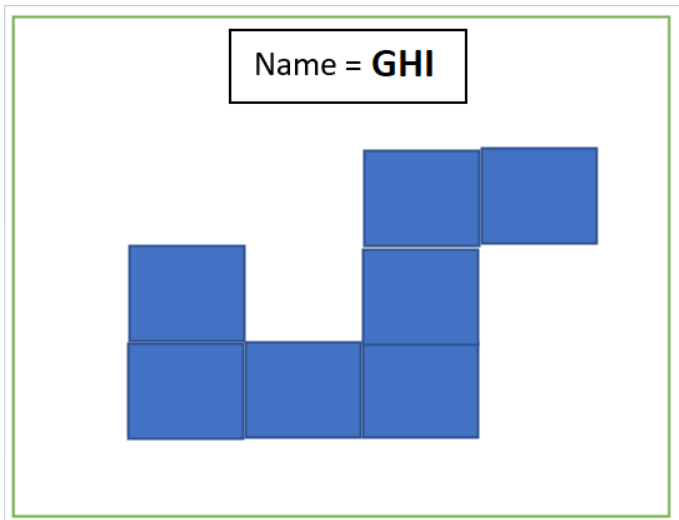
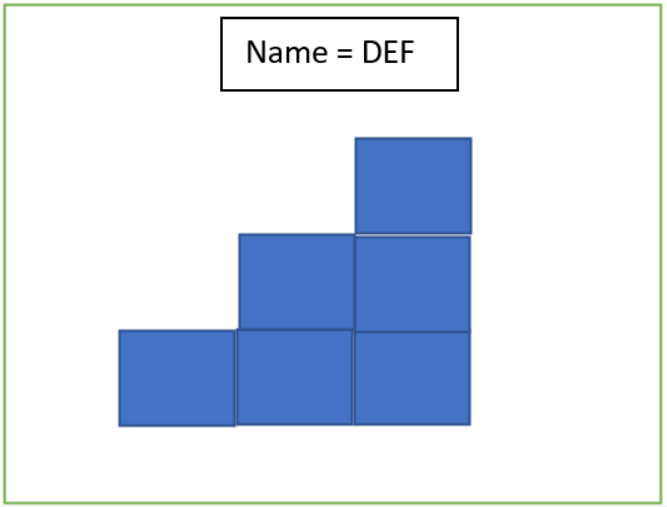
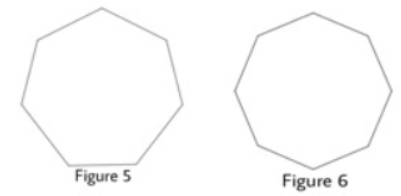
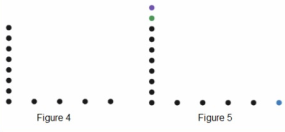
It is required to draw the 4th and 5th figures.
We will draw the 4th and 5th figure according to the property of the dot pattern.
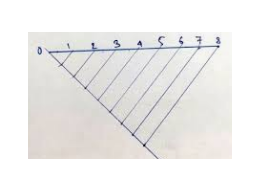
The dots on the horizontal line=1+ number of figures and the dots on the vertical line=2×number of figures.
Dots on the vertical line and horizontal line follow the following pattern
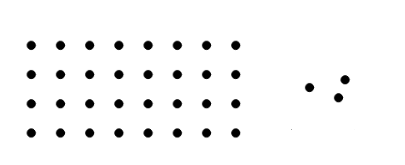
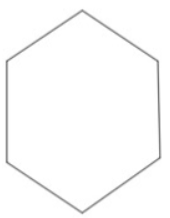
For figure 4
The dots on the horizontal line are
=1+4
=5,
And the dots on the vertical line are
=2×4
=8
Similarly,
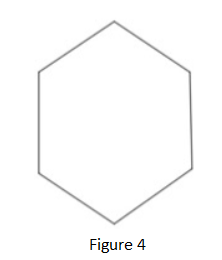
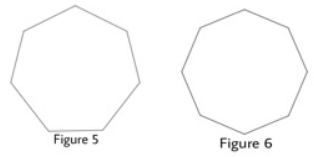
for figure 5 the dots on the horizontal line are
=1+5
=6
And the dots on the vertical line are
=2×5
=10
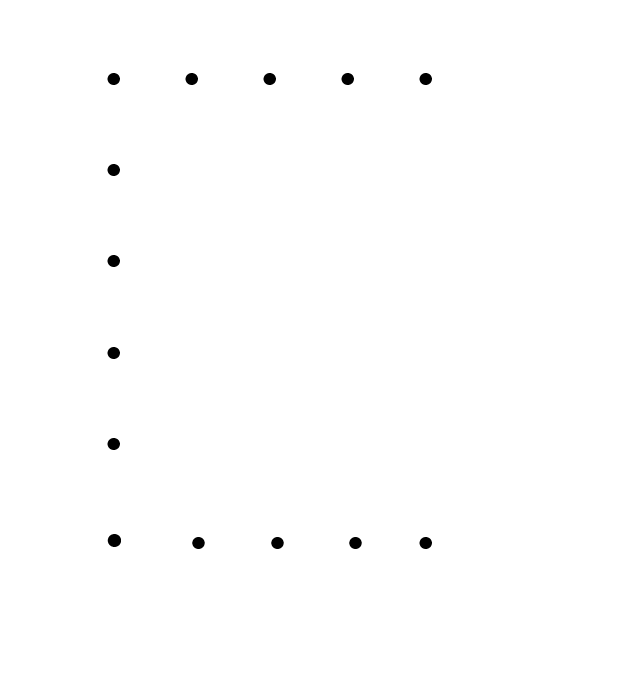
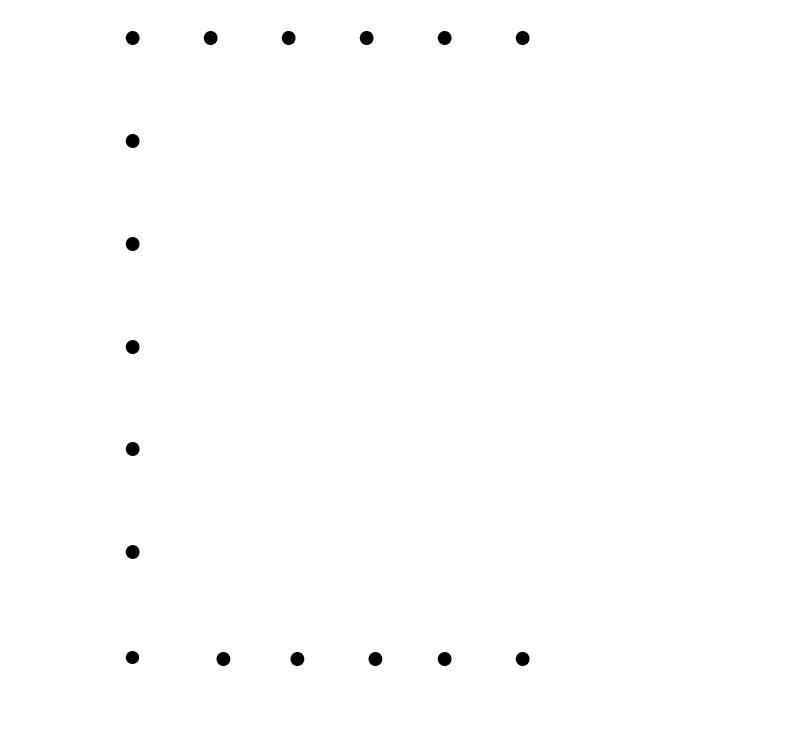
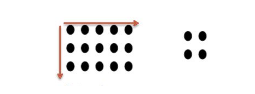
Figure 4 and 5 are shown as below.
Thus, we draw the 4th and 5th figures

Chapter 2 Closure Exercise Arithmetic Strategies and Area solutions Core Connections Course 1 Page 91 Problem 3 Answer
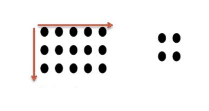
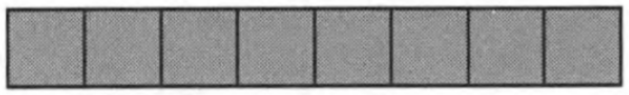
The given figure is

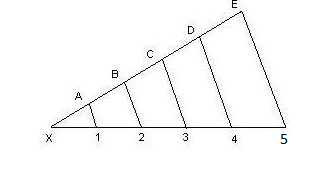
It is required to determine the number of dots in 30thfigure.
We will determine the number of dots according to the property of the dot pattern.
The dots on the horizontal line = number of figures and The dots on the vertical line =2×number of figures.
Dots on the vertical line and Horizontal line follow the following pattern
The dots on the horizontal line = number of figures
So, the dots of the horizontal line=30 and
The dots on vertical line=2×number of figures.
So, there will be total of 60 dots in vertical line in 30th Figure.
Thus, there will be 60 dots in the vertical line and 30 dots in the horizontal line in 30th figure.
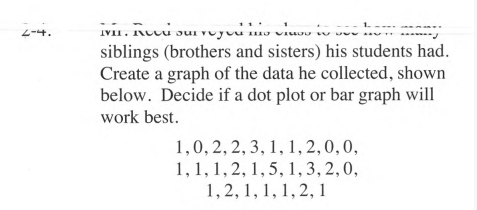
Core Connections Course 1 Chapter 2 Page 91 Problem 4 Answer
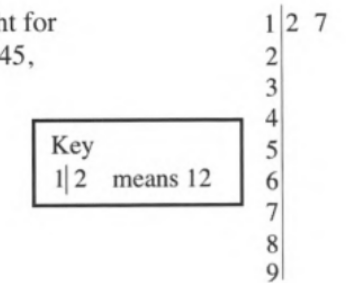
The given figure is
It is required to determine the oldest president at the time of inauguration.
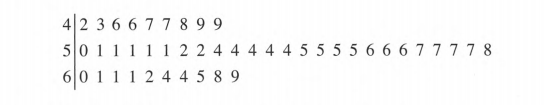
We will determine the oldest president according to the property of the stem-and-leaf plot.
The initial digit or digits of a value are the stem; the last digit of a value is the leaf.
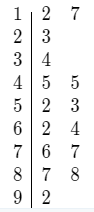
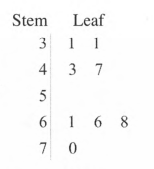
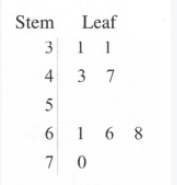
The stem and leaf plot is given below.

To find the oldest president, we have to look for the last leaf of the last stem.
A stem and leaf table is a data display table.
The initial digit or digits are displayed in the ‘stem’ on the left The ‘leaf,’ which is on the right, shows the last digit.
In this problem, we need to go to the last stem which is the initial digit of the number that is the age of the oldest president, and secondly, we have to check the last leaf which is displayed the last digit of the number which is the age of the oldest president.
Finally, we get:
The last stem is 6 and the last leaf is 9. The oldest president is 69 years old.
Thus, the age of the oldest president at the time of the inauguration was 69 years.
Chapter 2 Closure Exercise Arithmetic Strategies and Area solutions Core Connections Course 1 Page 91 Problem 5 Answer
The given figure is

It is required to determine the youngest president at the time of inauguration.
We will determine the youngest president according to the property of the stem-and-leaf plot.
The initial digit or digits of a value are the stem; the last digit of a value is the leaf.
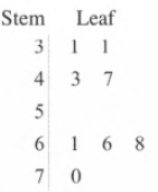
The stem and leaf plot is given below.

To find the youngest president we have to look for the first leaf of the first stem.
The youngest president is 42 years old.
Thus, the age of the youngest president at the time of the inauguration was 42 years.
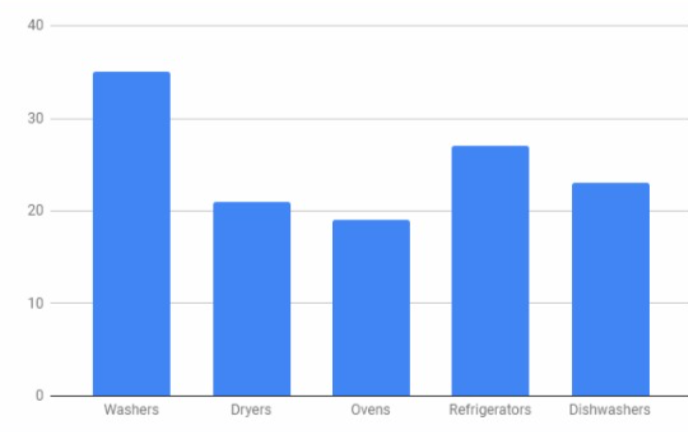
Core Connections Course 1 Chapter 2 Page 92 Problem 6 Answer
The given figure is
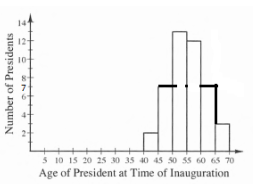
It is necessary to complete the missing bar.
We will fill up the missing bar according to the property of the histogram.
At first, we have to find a bin that represents a given range of values (class interval).
The range refers to the specific values of the minimum and maximum values.
You want to see the form of the data distribution when deciding if the output of a process is distributed almost normally.
Examining if a technique can suit a customer’s needs.
A histogram’s shape might lead to important inferences regarding the data’s trend(s).

On the horizontal axis, place the range of the empty space.
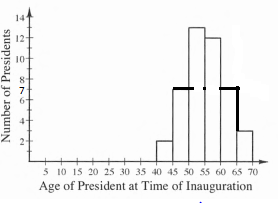
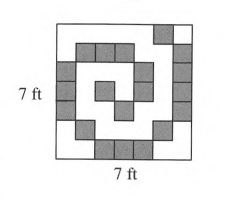
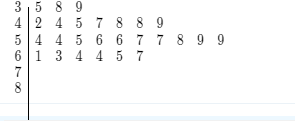
From the diagram, it is cleared that the range is the number of presidents between the age 60−64.
On the vertical axis, place frequencies, by calculating the last stem and last leaf and we get the number of presidents(height) 7.
Their ages are 60,61,61,61,62,64, and 64 years
The number of presidents between the age of 60 to 64 , when inaugurated, are 7
So the missing graph is between 60−65
The height of the bar will be 7 as that is the number of presidents of that age.
Thus, the height of the bar will be 7 as that is the number of presidents of that age.
Core Connections Course 1 Chapter 2 Page 92 Problem 7 Answer
The given figure is

It is required to determine the number of U.S. presidents who were younger than 50 years old at the time of their inauguration.
We will determine the number of U.S presidents according to the property of the histogram.
At first, we have to find a bin that represents a given range of values (class interval).
The range refers to the specific values of the minimum and maximum values.
You want to see the form of the data distribution when deciding if the output of a process is distributed almost normally.
Examining if a technique can suit a customer’s needs.
A histogram’s shape might lead to important inferences regarding the data’s trend(s).
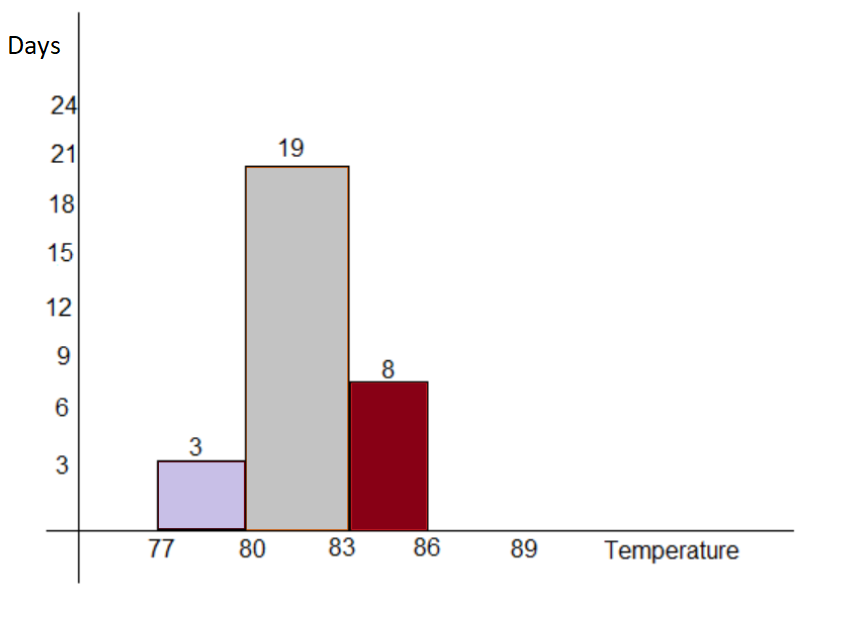
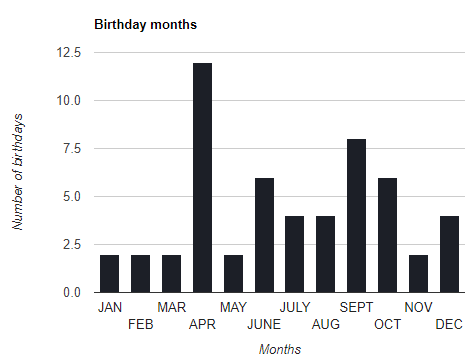
Given histogram is
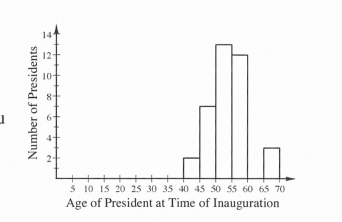
The range of age less than 50 are 40−45 and 45−50.
So we measure the height of the bars, height for age 40-45=2,height for age 45-50=7.
So, the number of presidents younger than 50 years old at the time of inauguration2+7=9.
Thus, the number of presidents younger than 50 years old at the time of inauguration is 9.
Core Connections Course 1 Chapter 2 Closure Exercise step-by-step solutions Page 92 Problem 8 Answer
The given figure is

It is required to determine the number of U.S. presidents that are represented by this data.
We will determine the number of U.S presidents according to the property of the histogram.
At first, we have to find a bin that represents a given range of values (class interval).
The range refers to the specific values of the minimum and maximum values.
You want to see the form of the data distribution when deciding if the output of a process is distributed almost normally.
Examining if a technique can suit a customer’s needs.

A histogram’s shape might lead to important inferences regarding the data’s trend(s).
The height of all the bars represents the number of presidents represented by this data.
The height is 2 in range between 40−45, the height is 7 in the range between 45−50, the height is 13 in the range between 50−55, the height is 12 in the range between 55−60 and the height is 3 in the range between 65−70.
Total height =2+7+13+12+3=37.
Thus, the height of all the bars represents the number of presidents represented by this data and the total height is 37.
Core Connections Course 1 Chapter 2 Page 92 Problem 9 Answer
Given: The factorization of 16.
It is required to list all of the factors of 16.
We will list all the factors according to the property of the factorizations.
The factorization approach employs the basic factorization formula to simplify any algebraic or quadratic problem by representing the equations as the product of factors rather than expanding the brackets.
A number, a variable, or an algebraic expression can all be factored in an equation.
All the factors of 16 are :
Factors of 16 are 2,4,8.
2,4 and 8 are factors of 16 because 16÷2=8 exactly, 16÷4=4 exactly and, 16÷8=2 exactly.
Thus, we list all the factors of 16 and they are 2,4,8
Core Connections Course 1 Chapter 2 Closure Exercise step-by-step solutions Page 92 Problem 10 Answer
Given: The factorization of 18.It is required to list all of the factors of 18.
We will list all the factors according to the property of the factorizations.
The factorization approach employs the basic factorization formula to simplify any algebraic or quadratic problem by representing the equations as the product of factors rather than expanding the brackets.
A number, a variable, or an algebraic expression can all be factored in an equation.
All the factors of 18 are :Factors of18=2,3,6,9.
Because 18÷2=9 exactly,
18÷3=6 exactly,
18÷6=3 exactly and,
18÷9=2 exactly.
Thus, we list all the factors of 18 and they are 2,3,6,9.
Core Connections Course 1 Chapter 2 Page 92 Problem 11 Answer
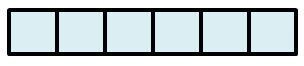
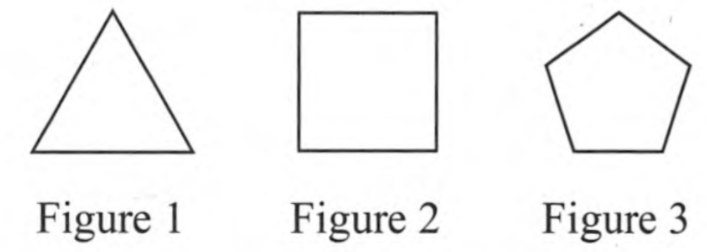
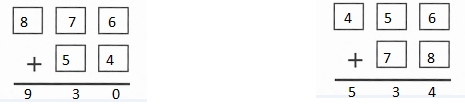
The given digits 4,7,5,6, and 8 and the given figure is
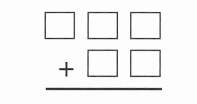
It is required to make the largest and smallest sums.
We will make sums according to the property of the sums.
We arrange the digits in descending order.
The result or answer we get when we add two or more numbers is known as sums then we arrange the digits in ascending order.
The result or answer we get when we add two or more numbers is known as sums.
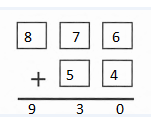
To find the maximum sum from digits 4,7,5,6 and 8. we have to find two biggest numbers from the given numbers.
We can arrange the numbers in descending order :8,7,6,5,4
The maximum sum will be 876+54=930
To find the minimum sum from digits 4,7,5,6 and 8. we have to find two smallest numbers from the given numbers.
We can arrange the numbers in ascending order : 4,5,6,7,8
The minimum sum will be 456+78=534
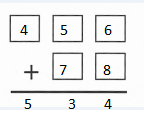
Thus, we place the digits4,7,5,6, and 8 in the boxes to make the largest and smallest sums possible and we get the maximum sum is 930 and the minimum sum is 534.
the boxes are shown below
Core Connections Course 1 Chapter 2 Page 92 Problem 12 Answer
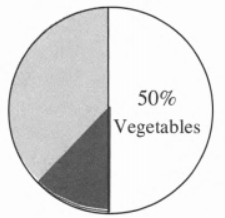
Given: Out of 50 students, 15 are taking English and 30 are taking chemistry.
Of those students taking English and chemistry, 6 are in both classes.
It is required to determine the number of students who are taking chemistry and not English.
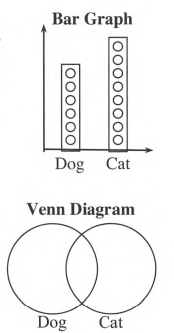
We will determine the number of students, according to the property of the Venn diagram.
Draw three circles that overlap to make an intersecting Venn diagram.
You’ll be able to demonstrate which qualities are unique to each circle, which overlap between two circles, and which are shared by all three groups.
To read a Venn diagram, look at all of the circles that make up the whole thing.
Each circle represents a separate item or data set.
There are total 50 students, 15 students are taking English, 30 students are taking chemistry, and 6 are taking both courses.
The Venn diagram is drawn below:

The number of students taking chemistry and not English =Students taking chemistry −Students taking both.
30−6=24
24 students are taking chemistry and not English.
Thus, the Venn diagram is and 24 students are taking chemistry and not English.

Core Connections Course 1 Chapter 2 Page 92 Problem 13 Answer
Given: Out of 50 students,15 are taking English and 30 are taking chemistry.
Of those students taking English and chemistry,6 are in both classes.
It is required to determine the number of students who are taking English and not chemistry.
We will determine the number of students according to the property of the Venn diagram.
Draw three circles that overlap to make an intersecting Venn diagram.
You’ll be able to demonstrate which qualities are unique to each circle, which overlap between two circles, and which are shared by all three groups.
To read a Venn diagram, look at all of the circles that make up the whole thing.
Each circle represents a separate item or data set.
There are total 50 students, 15 students are taking English, 30 students are taking chemistry, and 6 are taking both courses.
The Venn diagram is drawn below:

The number of students taking English and not chemistry= students taking English−students taking both.
15−6=9
Thus, the Venn diagram is

And 9 students are taking English and not chemistry.
Chapter 2 Closure Arithmetic Strategies and Area explained Core Connections Course 1 Page 92 Problem 14 Answer
Given: Out of 50 students,15 are taking English and 30 are taking chemistry.
Of those students taking English and chemistry, 6 are in both classes.
It is required to determine the number of students who are taking neither of the classes we will determine the number of students, according to the property of the Venn diagram.
Draw three circles that overlap to make an intersecting Venn diagram.
You’ll be able to demonstrate which qualities are unique to each circle, which overlap between two circles, and which are shared by all three groups.
To read a Venn diagram, look at all of the circles that make up the whole thing.
Each circle represents a separate item or data set.
There are total 50 students, 15 students are taking English, 30 students are taking chemistry, and 6 are taking both courses.
The Venn diagram is drawn below:

The number of students taking neither of the classes= Total students−Students taking English−
Students taking chemistry +Students taking both.
50−30−15+6=11
Thus, the Venn diagram is

And 11 students are taking neither of the classes.
Chapter 2 Closure Arithmetic Strategies and Area explained Core Connections Course 1 Page 92 Problem 15 Answer
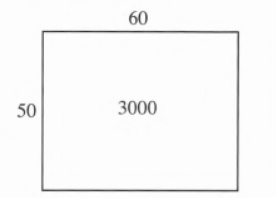
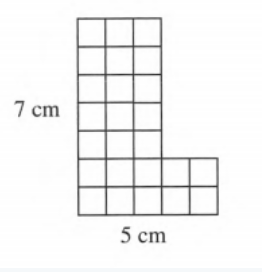
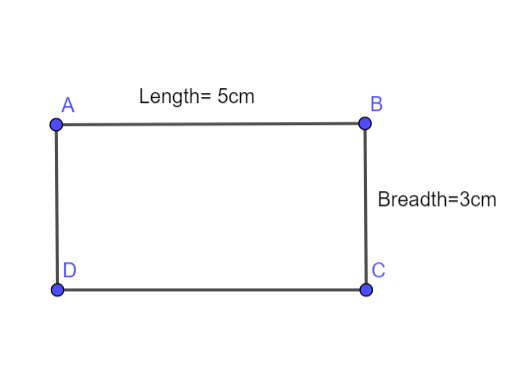
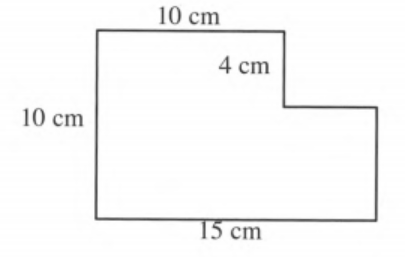
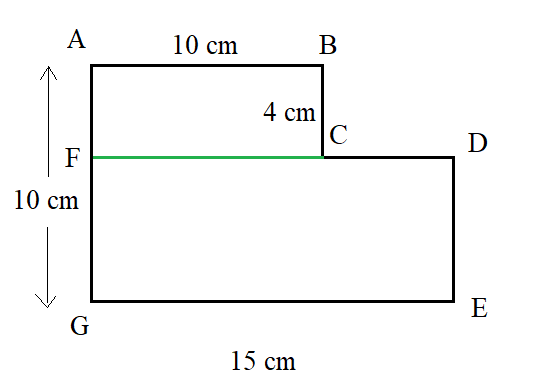
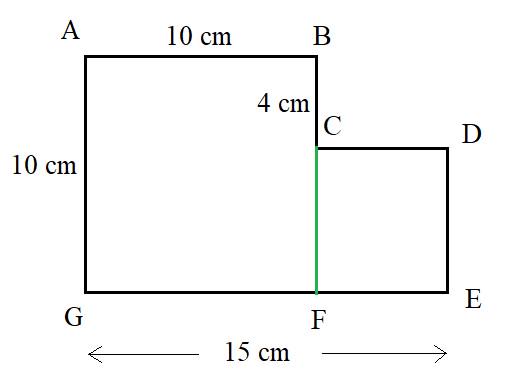
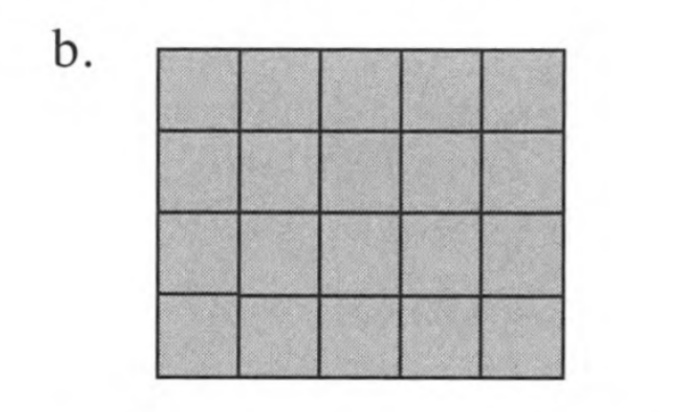
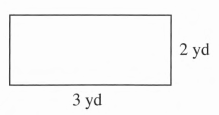
The given figure is

It is required to determine the area of the rectangle.
We will determine the area according to the formula of the area of a rectangle.
The basic formula of the area of the rectangle is length × width.
In this question, the length is 3 yards and width is 2 yards.
We need to put the values of length and width in the formula of the area of the rectangle and we get the result.
The given rectangle has length 3 yard and width 2 yard. Since area of the rectangle is Area = length × width
The area of the given rectangle is Area
=3×2
=6 square yards
=(3×3)×(2×3)
Multiplying 3 by 3, we know that1 yards=3 feet
∴3 yard=9 feet
=54 square feet
Thus, the area of the rectangle is 6 square yards and 54 square feet in square yards and square feet, respectively.

worked examples for Core Connections Course 1 Chapter 2 Closure Exercise Arithmetic Strategies and Area Page 92 Problem 16 Answer
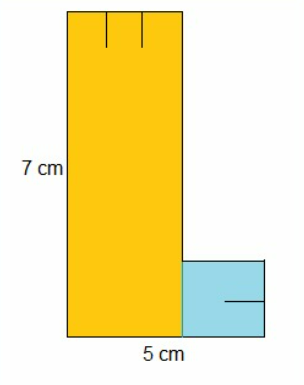
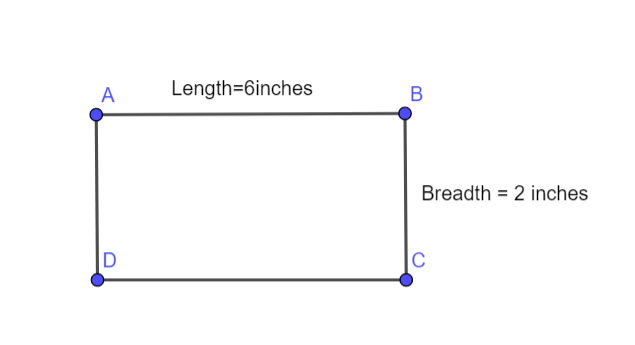
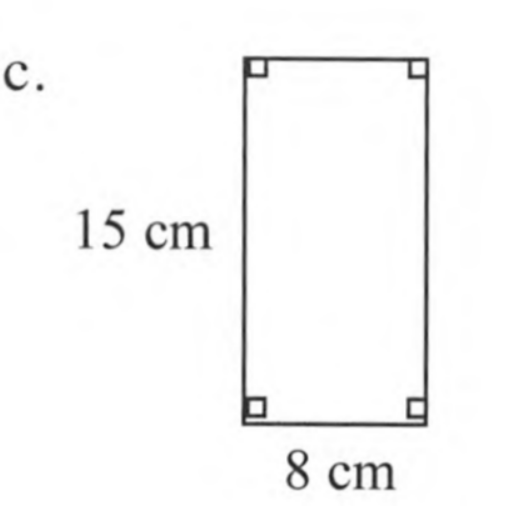
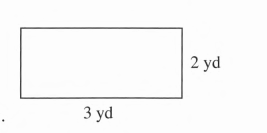
The given figure is
It is required to determine the perimeter of the rectangle.
We will determine the perimeter according to the formula of the perimeter of the rectangle.
The basic formula of the perimeter is2(length+width).
In this question, the length is 3 yards and the width is 2 yards We need to put the values of length and width in the formula of the perimeter of the rectangle and we get the result.
The given rectangle has length 3 yard and width 2 yard. Since the perimeter of the rectangle is
Perimeter =2×( length + width )
The perimeter of the given rectangle is Perimeter
=2×(3+2)
=10 yards
=2×(3×3+2×3)
Multiplying by 3 and 3, we know that 1 yard =3 feet
∴3 yards=9 feet
=2×15
=30 feet
Thus, the perimeter of the rectangle is 10 yards and 30 feet in yards and feet, respectively.
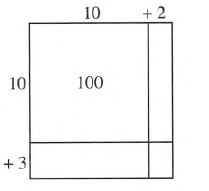
Core Connections Course 1 Chapter 2 Page 93 Problem 17 Answer
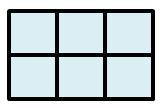
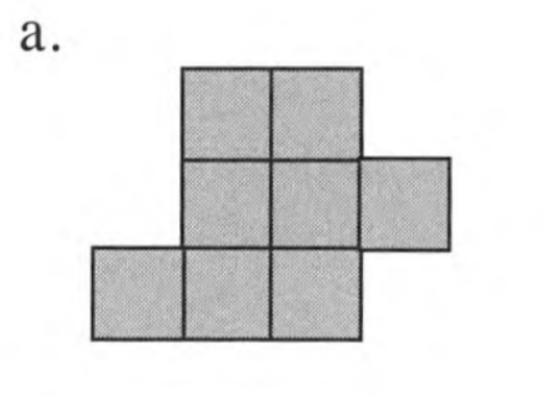
The given figure is
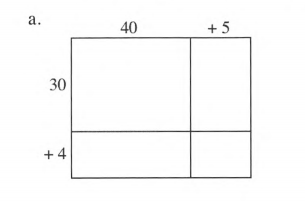
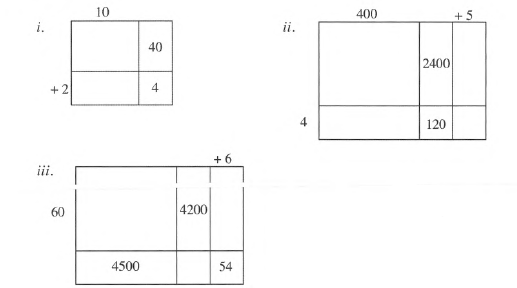
It is required to complete these generic rectangles.
We will complete these generic rectangles according to the property of the generic rectangles.
Multiplication with generic rectangles is based on the principle of breaking down a product into parts.
Because the measurements are not to scale, we use the term “generic.”
The multiplication algorithm is reinforced when rectangular models are used.
Multiply the outside term by the inner terms, or distribute the outer term to the inner terms.
Combine phrases that are similar.
Arrange the phrases such that the variables and constants are on different sides of the equals sign.
Solve the problem and, if necessary, simplify it.
The Distributive Property states that the multiplier of a sum or difference can be “distributed” to multiply each term.
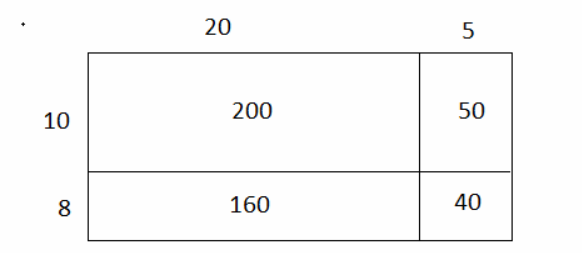
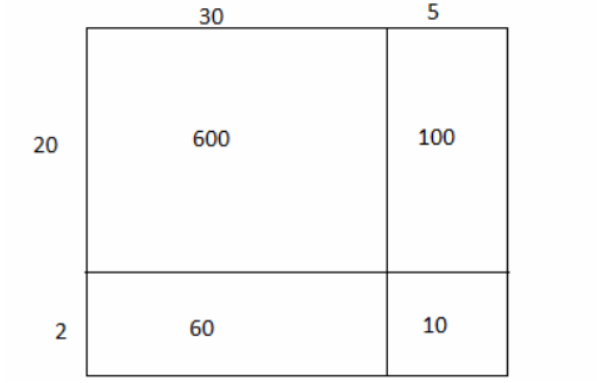
To multiply,30×40,30×5,4×40, and 4×5, written as 30⋅(40+5), and 4⋅(40+5), you can use the generic rectangle model.
34×45
(30+4)⋅(40+5)
=30⋅(40+5)+4⋅(40+5)
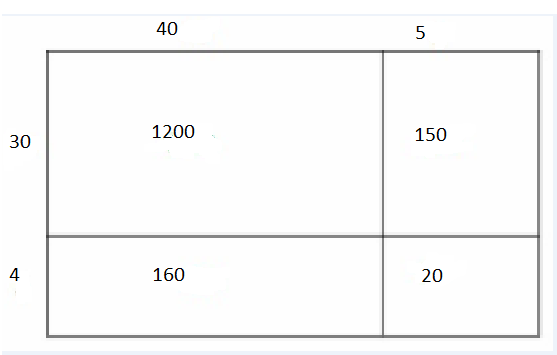
=30×40+30×5+4×40+4×5
=1200+150+160+20
=1350+180
=1530
The completed generic rectangles are:

Thus, we complete these generic rectangles.
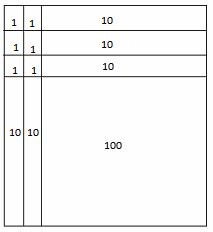
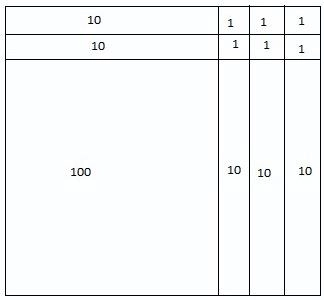
Core Connections Course 1 Chapter 2 Page 93 Problem 18 Answer
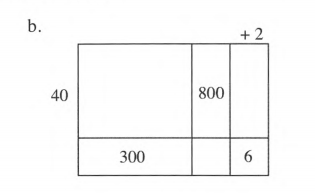
The given figure is
It is required to complete these generic rectangles.
We will complete these generic rectangles according to the property of the generic rectangles.
Multiplication with generic rectangles is based on the principle of breaking down a product into parts.
Because the measurements are not to scale, we use the term “generic.”
The multiplication algorithm is reinforced when rectangular models are used.
Multiply the outside term by the inner terms, or distribute the outer term to the inner terms.
Combine phrases that are similar.
rrange the phrases such that the variables and constants are on different sides of the equals sign.
Solve the problem and, if necessary, simplify it.
The Distributive Property states that the multiplier of a sum or difference can be “distributed” to multiply each term.
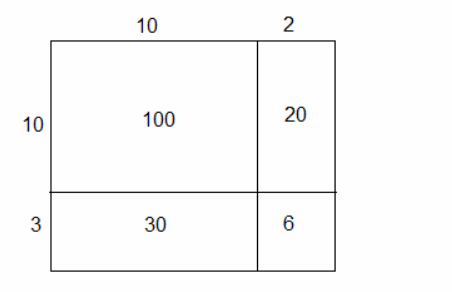
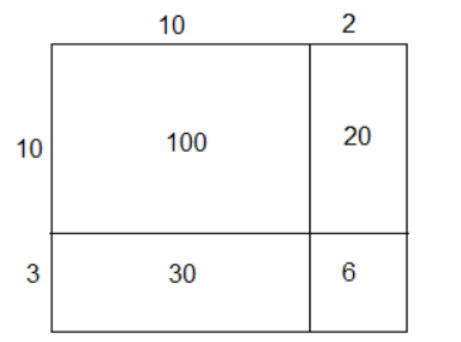
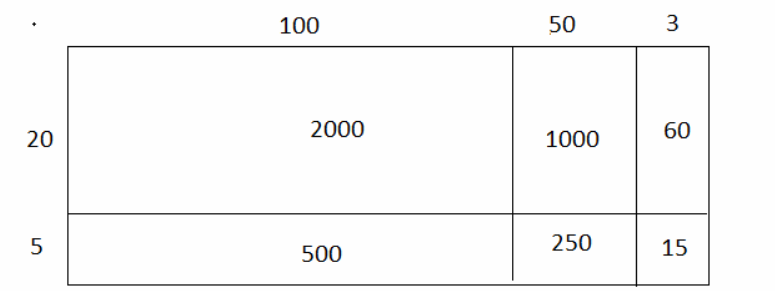
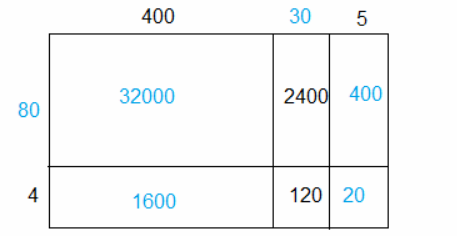
To multiply, 40×100,40×20,40×2,3×100,3×20, and 3×2, written as 40⋅(100+20+2) and 3⋅(100+20+2), you can use the generic rectangle model.
43×122
(40+3)⋅(100+20+2)
=40⋅(100+20+2)+3⋅(100+20+2)
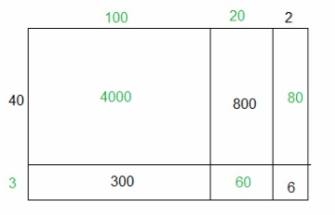
=40×100+40×20+40×2+3×100+3×20+3×2
=4000+800+80+300+60+6
=4880+366
=5246
Complete these generic rectangles
Thus, we complete these generic rectangles

worked examples for Core Connections Course 1 Chapter 2 Closure Exercise Arithmetic Strategies and Area Page 93 Problem 19 Answer
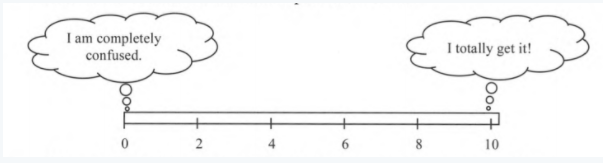
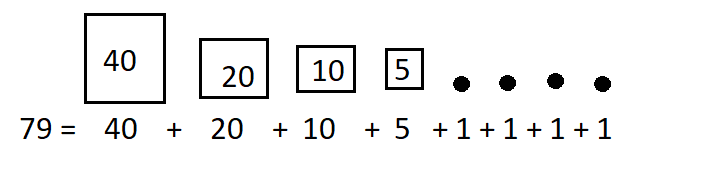
Given: A bar or number line.
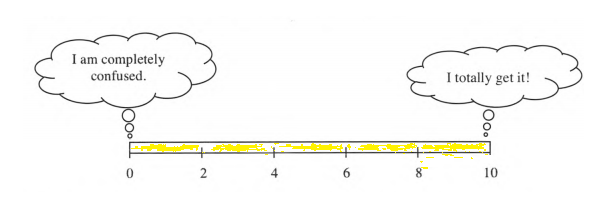
It is asked that we use the bar or number line to convey my comprehension.
We convey my comprehension according to the theory of the given book.
We will use the theories.
They are the generic rectangle, dot plot, the stem, and leaf, histogram, factors, a Venn diagram, the formula of the area and perimeter of the rectangle, etc.
The bars will be
The yellow color of the bar represents my level of understanding and comfort with completing all problems on my own.
For each of the problems above, all of the bars are a 10.
For example, we choose a problem CL2−91.
We would like to ask about that problem
Can I solve the given problem using the method of the generic rectangle?Which multiplication table do I need to use?
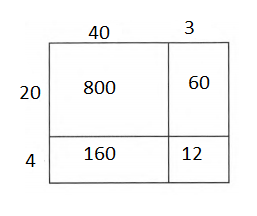
A new problem is: Ben found an incomplete multiplication table puzzle. Help him fill in the empty boxes.
A grocery store owner ordered 43 boxes of donuts to sell in her bakery section. There are 24 donuts in each box. How many donuts will she receive in total?
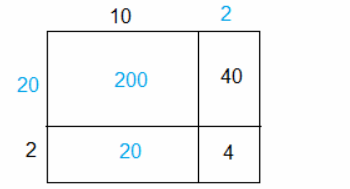
The Distributive Property states that the multiplier of a sum or difference can be “distributed” to multiply each term.
To multiply, 20×40,20×3,4×40 and 4×3 written as 20.(40+3) and 4⋅(40+3), you can use the generic rectangle model.
Complete these generic rectangles
Thus, she will receive 1032 donuts.
Thus, the number line is as follows: