Big Ideas Math Integrated Math Chapter 5 Maintaining Mathematical Proficiency
Big Ideas Math Integrated Math 1 Student Journal Chapter 5 Solutions Page 121 Exercise 1 Problem 1
Question 1.
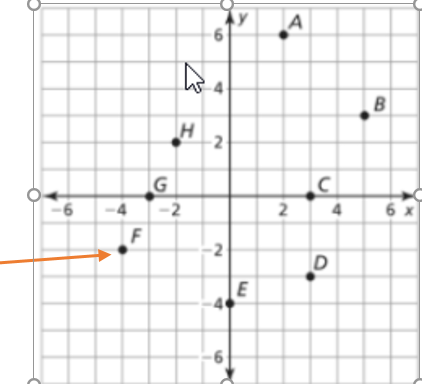
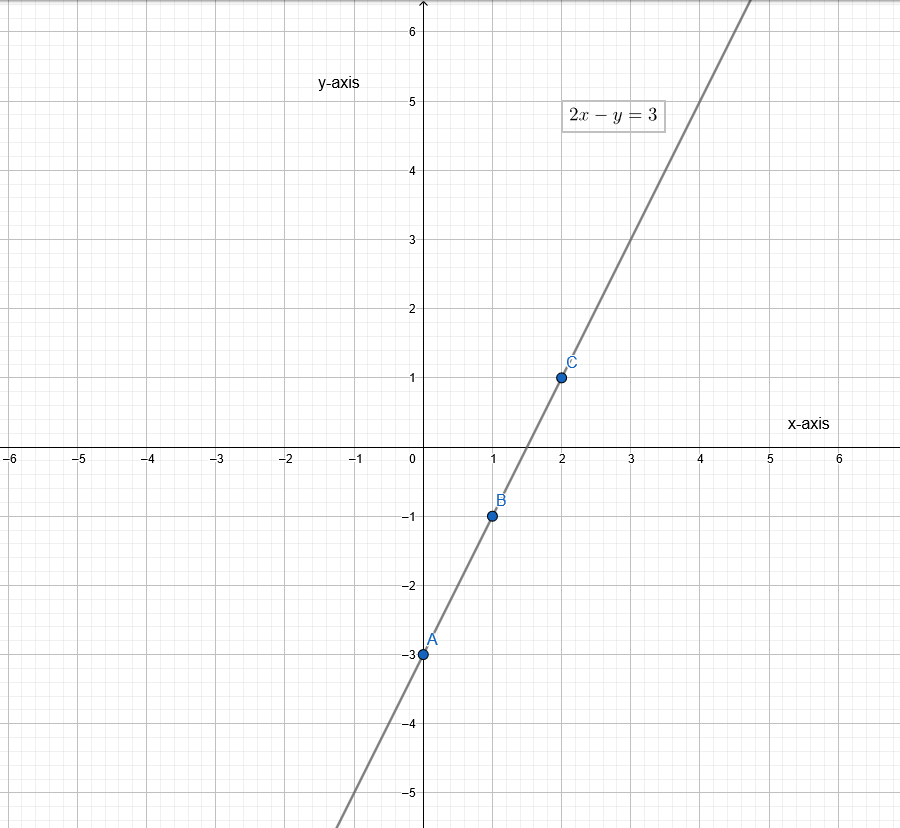
Given the equation 2x − y = 3, we need to find the points satisfying the equation and plot the graph of the equation.
- Find the points satisfying the equation 2x − y = 3 by choosing values for x from the set of real numbers (R) and solving for y.
- Plot the graph of the equation using the points obtained.
Answer:
Given
We have, 2x − y = 3
We will find the points satisfying the given equation to plot the graph, by taking the value of y from R and obtaining the value ofx corresponding to the value of y
Read and Learn More Big Ideas Math Integrated Math 1 Student Journal Solutions
Find the points satisfying the given equation.
2x − y = 3
⇒ y = 2x − 3
Plot the graph.
Page 121 Exercise 2 Problem 2
Question 2.
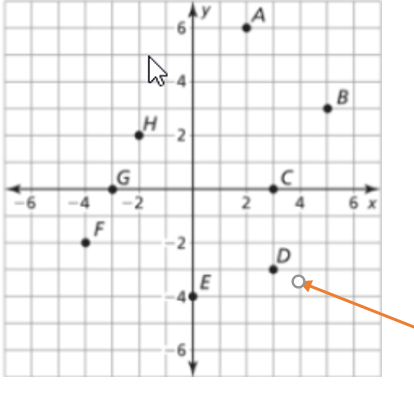
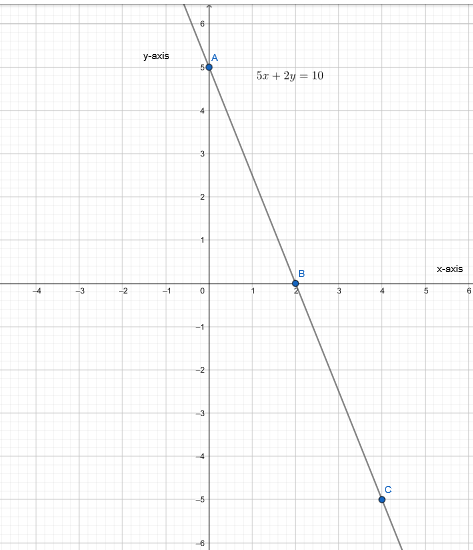
Given the equation 5x+2y=10, we need to find points that satisfy this equation, plot them, and draw the graph of the equation.
- Find points satisfying the equation 5x + 2y = 10.
- Plot the graph of the equation using these points.
Answer:
We have, 5x + 2y = 10
We will find the points satisfying the given equation to plot the graph, by taking the value of y from Rand obtaining the value of x corresponding to the value of y
or vice versa.
Find the points satisfying the given equation.
5x + 2y = 10
⇒ y = \(\frac{10−5x}{2}\)
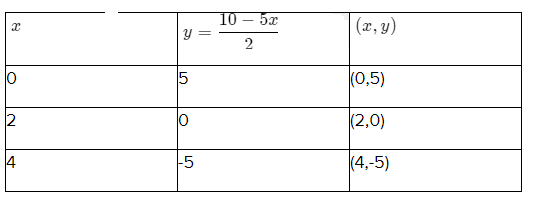
Plot the graph.

The graph of an equation 5x + 2y = 10 is
Page 121 Exercise 3 Problem 3
Question 3.
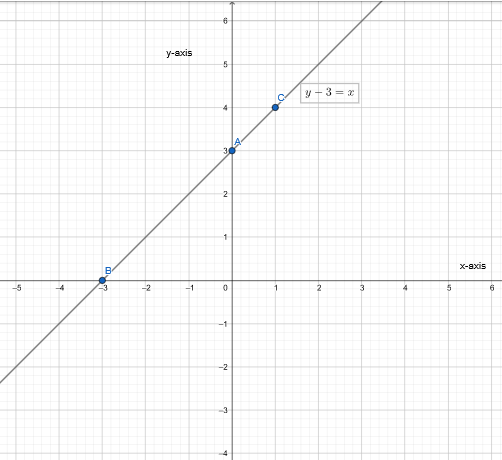
Given the equation y−3 = x, we need to find points that satisfy this equation, plot them, and draw the graph of the equation.
- Find points satisfying the equation y−3 = x.
- Plot the graph of the equation using these points.
Answer:
We have, y − 3 = x
We will find the points satisfying the given equation to plot the graph, by taking the value of y from R and obtaining the value of x corresponding to the value of y.
Find the points satisfying the given equation.
y − 3 = x
⇒ y = x + 3
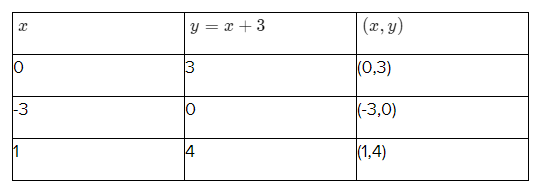
Plot the graph.

The graph of an equation y−3 = x is
Chapter 5 Maintaining Mathematical Proficiency Solutions Big Ideas Math Integrated Math 1 Page 121 Exercise 4 Problem 4
Question 4.
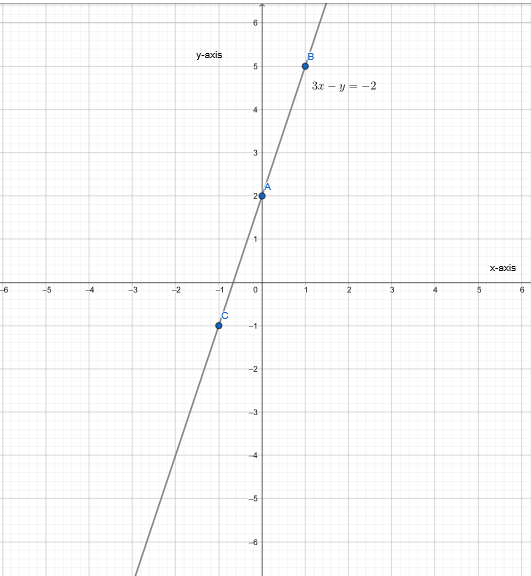
Given the equation 3x−y=−2, we need to find points that satisfy this equation, plot them, and draw the graph of the equation.
- Find points satisfying the equation 3x−y = −2.
- Plot the graph of the equation using these points.
Answer:
We have, 3x − y = − 2
We will find the points satisfying the given equation to plot the graph, by taking the value of y from R and obtaining the value of x corresponding to the value of y.
Find the points satisfying the given equation.
3x − y = −2
⇒ y = 3x + 2
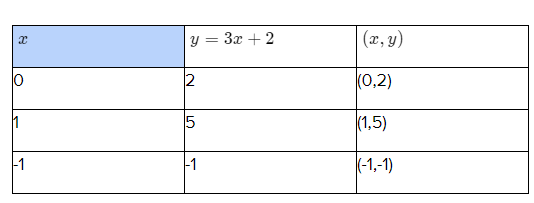
Plot the graph.

The graph of an equation 3x − y = −2 is
Page 121 Exercise 5 Problem 5
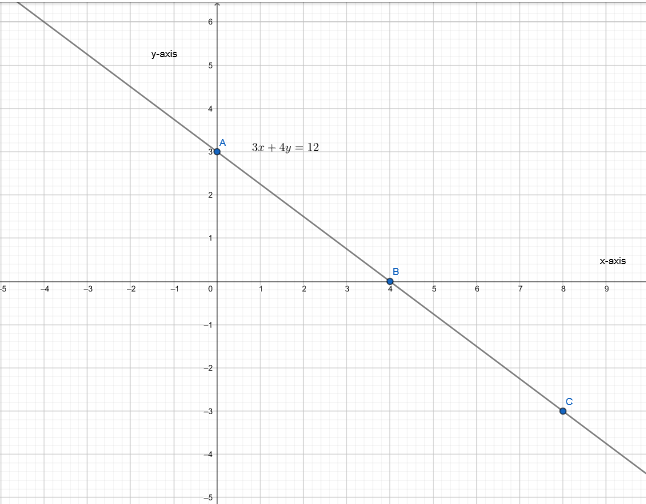
Question 5.
- Find points that satisfy the equation 3x + 4y = 12.
- Plot the graph of the equation using these points.
Answer:
Find the points satisfying the given equation.
3x + 4y = 12
⇒ y = \(\frac{12−3x}{4}\)
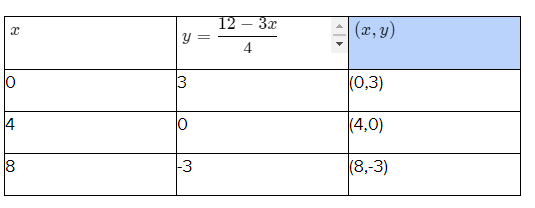
Plot the graph.

The graph of an equation 3x + 4y = 12 is
Page 121 Exercise 6 Problem 6
Question 6.
- Solve the inequality a−3 > −2.
- Plot the graph of the solution.
Answer:
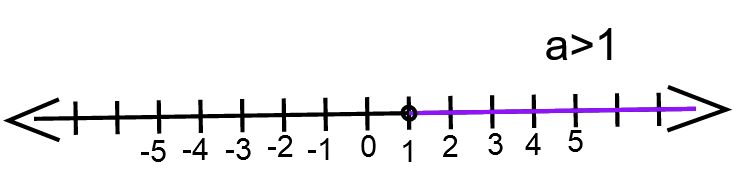
We have, a − 3 > − 2
⇒ a>1
The graph for a > 1 ⇒
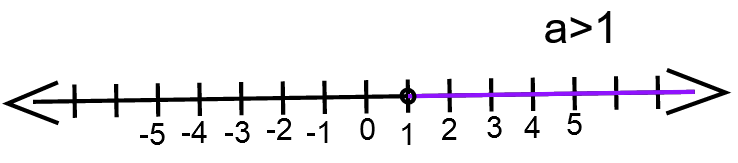
The solution of an inequality a−3>−2 is a>1 and the graph of the solution is
Page 121 Exercise 7 Problem 7
Question 7.
- Solve the inequality −4 ≥ −2c.
- Plot the graph of the solution.
Answer:
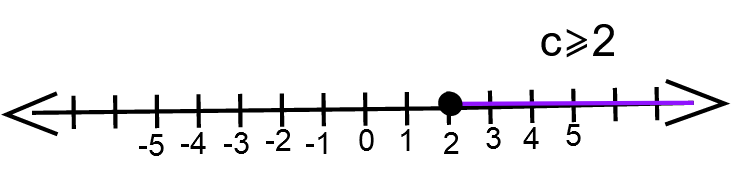
We have,−4 ≥ − 2c
⇒ −2 ≥ − c
⇒ 2 ≤ c
⇒ c ≥ 2
The graph for c ≥ 2 ⇒
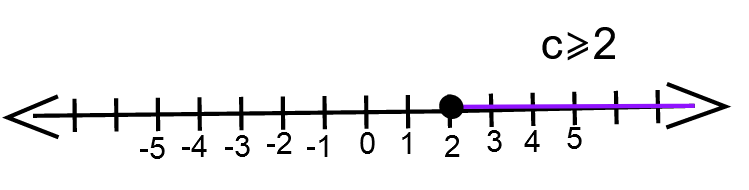
The solution of an inequalit y − 4 ≥ −2c is c≥2 and the graph of the solution is
Page 121 Exercise 8 Problem 8
Question 8.
- Solve the inequality 2d − 5 < −3.
- Plot the graph of the solution.
Answer:
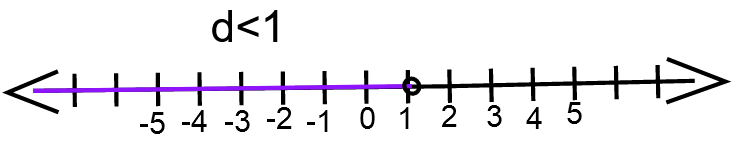
We have ,2d − 5<− 3
⇒ 2d < 2
⇒ d < 1
The graph for d < 1 ⇒
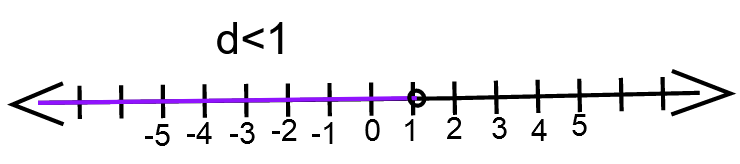
The solution of an inequality 2d−5<−3 is d<1 and the graph of the solution is
Big Ideas Math Integrated Math 1 Chapter 5 Step-By-Step Solutions Page 121 Exercise 9 Problem 9
Question 9.
- Solve the inequality 8 − 3r ≤ 5 − 2r.
- Plot the graph of the solution.
Answer:
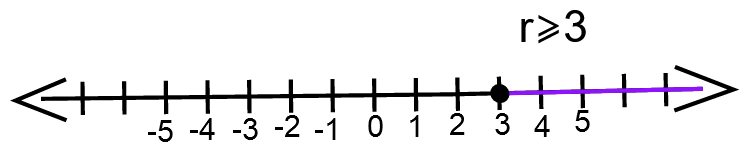
We have, 8 − 3r ≤ 5 − 2r
⇒ −r ≤ −3
⇒ r ≥ 3
The graph for r ≥ 3 ⇒
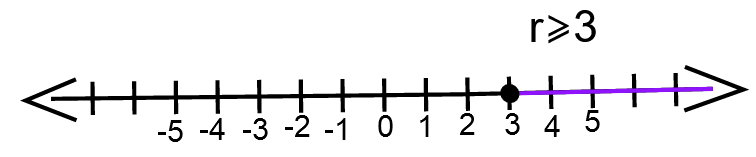
The solution of an inequality 8−3r ≤ 5−2r is r ≥ 3
Page 122 Exercise 10 Problem 10
Question 10.
Solve the following system of linear equations using both the substitution and elimination methods:
- x + y = 2
- x − y = 0
Answer:
We can use any of the two methods to solve a system of linear equations with two variables: Substitution and Elimination.
Substitution: Apply the following steps to solve a system of linear equations.
Isolate any one variable from one of the equations.
Put the isolated value in the other equation and solve the resulting equation.
Put the value of the variable obtained from the resulting equation in any of the two equations and find the value of the other variable.i.e.
x + y = 2 ——— (1)
x−y = 0 ———–(2)
From equation (1)
⇒ x + y = 2
⇒ x = 2−y
Putting the value of x in equation (2), we get
(2−y)−y = 0
⇒ y = 1
x−y = 0 from equation (2)
x = 2−y
⇒ x = 2−1
⇒ x = 1
Hence,(1,1) is the solution of a given system of linear equations.
Elimination: Observe the value of a variable with the same coefficients (i.e 2x & 2x or − 2 x & 2x).
If not, then rewrite one or both equations to get the expected values.
Perform addition or subtraction between two equations to get the solution.
Find the value of the other variable by putting the value obtained from the solution in one of the equations.
x + y = 2 −−−——-(1)
x − y = 0 −−——-−(2)
x + y = 2
(x − y) = 0
+
_____________
x = 1 ⇒ 1 + y = 2 ⇒ y = 1
Hence,(1,1) is the solution of a given system of linear equations.
We can use any of the two methods to solve a system of linear equations with two variables: Substitution and Elimination.
Page 122 Exercise 11 Problem 11
Question 11.
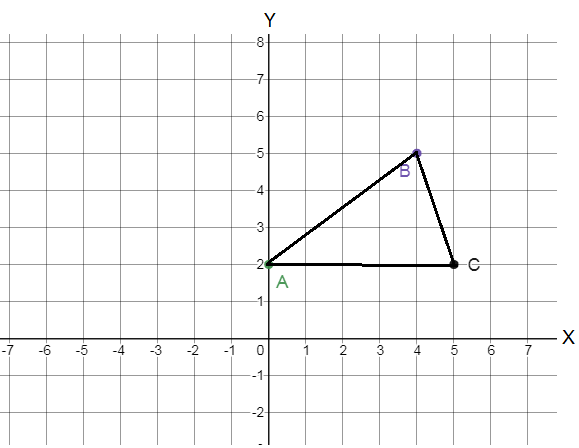
A family spends $600 preparing a bedroom to rent. The cost of food and utilities is $15 per night. Write an equation that represents the total cost C in dollars for renting the bedroom for x nights. Then, find the total cost if the bedroom is rented for 10 nights.
Answer:
Given:
The family spends $600 preparing a bedroom to rent.
The cost of food and utilities is $15 per night.
Suppose the number of nights is x and the total cost is C.
Hence, Cost(in dollars)= Rent of the bedroom for x nights + Amount spent on preparing a bedroom−−−(1)
Rent for x nights ⇒ 15x
Equation (1) ⇒ C = 15x + 600
C = 15x + 600 is an equation that represents the costs.
Page 122 Exercise 11 Problem 12
Question 12.
A family charges $75 per night to rent a bedroom. Write an equation that represents the total revenue R in dollars for renting the bedroom for x nights. Then, find the total revenue if the bedroom is rented for 10 nights.
Answer:
Given:
The family charges $75 per night to rent the bedroom.
Revenue for a night ⇒ 75 (dollars)
Total Revenue for x nights ⇒ 75x.
Revenue: R = 75x
R = 75x is an equation that represents the revenue.
Page 122 Exercise 11 Problem 13
Question 13.
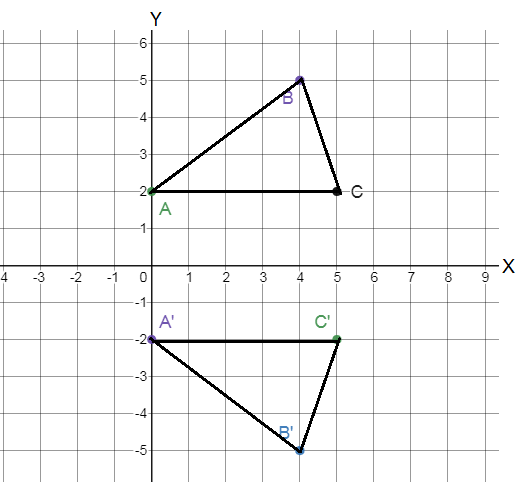
A family spends $600 preparing a bedroom to rent and incurs a cost of $15 per night for food and utilities. They charge $75 per night to rent the bedroom. Suppose the number of nights is x, the total cost is C, and the total revenue is R.
- Write a system of linear equations that represents the total cost and total revenue.
- How many nights must the bedroom be rented to break even?
Answer:
Given:
The family spends $600 preparing a bedroom to rent.
The cost of food and utilities is $15 per night.
Suppose the number of nights is x and the total cost is C.
Hence, Cost(in dollars) = Rent of the bedroom for x nights+ Amount spent on preparing a bedroom−−−(1)
Rent for x nights ⇒ 15x
equation (1) ⇒ C = 15x + 600
The family charges $75 per night to rent the bedroom.
Revenue for a night ⇒ 75 (dollars)
Revenue: R = 75x
Hence, C = 15x + 600 and R = 75x form the system of linear equations for this problem.
C = 15x + 600 and R = 75x forms the system of linear equations for this problem.
Solutions For Big Ideas Math Integrated Math 1 Chapter 5 Maintaining Mathematical Proficiency Exercises Page 123 Exercise 12 Problem 14
Question 14.
Given the system of linear equations:
x+y=2 (1)
x-y=0 (2)
Answer:
We can use any of the two methods to solve a system of linear equations with two variables: Substitution and Elimination.
Substitution: Apply the following steps to solve a system of linear equations.
Isolate any one variable from one of the equations.
Put the isolated value in the other equation and solve the resulting equation.
Put the value of the variable obtained from the resulting equation in any of the two equations and find the value of the other variable. i.e.
x + y = 2 −−———-(1)
x − y = 0 −——–−−(2)
From equation (1)
⇒ x + y = 2
x = 2−y
Putting the value of x in the equation (2), we get
(2−y)−y = 0
⇒ y = 1
x = 2 − y
⇒ x = 2 − 1
⇒ x = 1
Hence,(1,1) is the solution of a given system of linear equations.
Elimination:
Observe the value of a variable with the same coefficients(i.e or).
If not, then rewrite one or both equations to get the expected values.
Perform addition or subtraction between two equations to get the solution.
Find the value of the other variable by putting the value obtained from the solution in one of the equations.i.e.
x + y = 2 −−−——–(1)
x − y = 0 −−−——–(2)
x + y = 2
(x−y) = 0
+
_________________________
x = 1 ⇒ 1 + y = 2 ⇒ y = 1
Hence,(1,1) is the solution of a given system of linear equations.
To verify the solution for given points you just put the given values of x
and y in the given equations and check whether it satisfies both of the equations or not.
It is a solution if it satisfies both of the equations.
It is not a solution if it does not satisfy any of the equations.
i.e for
x + y = 2 —−−—-−(1)
x − y = 0 −−——-−(2)
(1,0) is not a solution for a given system of linear equations as it gives 1 after putting the values of both variables in equation (1).
Whereas (1,1) is a solution for a given system of linear equations as it satisfies both of the equations for given values of x and y
We can use any of the two methods to solve a system of linear equations with two variables: Substitution and Elimination. By putting the given values of variables in given equations we can check whether it is a solution for a given system of linear equations or not.
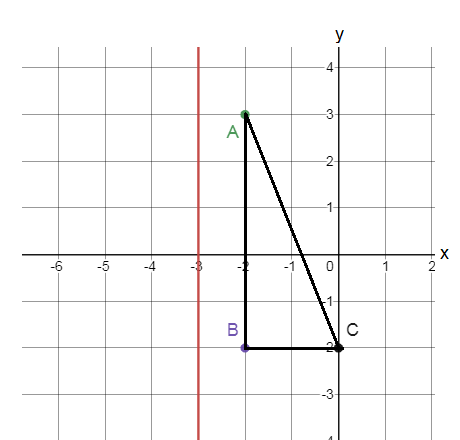
Big Ideas Math Integrated Math 1 Student Journal Chapter 5 guide Page 123 Exercise 13 Problem 15
Question 15.
Given the system of linear equations:
y=-4.3 x-1.3 (1)
y=1.7 x+4.7 (2)
We will solve the system using the graphing method.
Answer:
Given
y=-4.3 x-1.3 (1)
y=1.7 x+4.7 (2)
We have,y = −4.3x − 1.3 −−−——(1)
And y = 1.7x + 4.7 −−−————(2)
We will use graphing method to solve the system as it is easier to apply.
Find the points satisfying the given equation.
For equation (1)
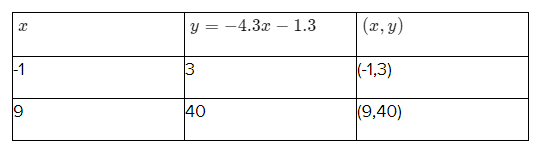
For equation (2)
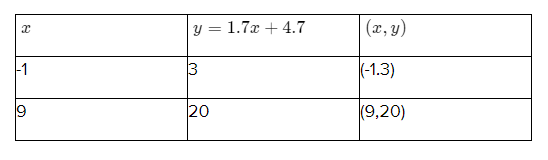
Plot the graph.
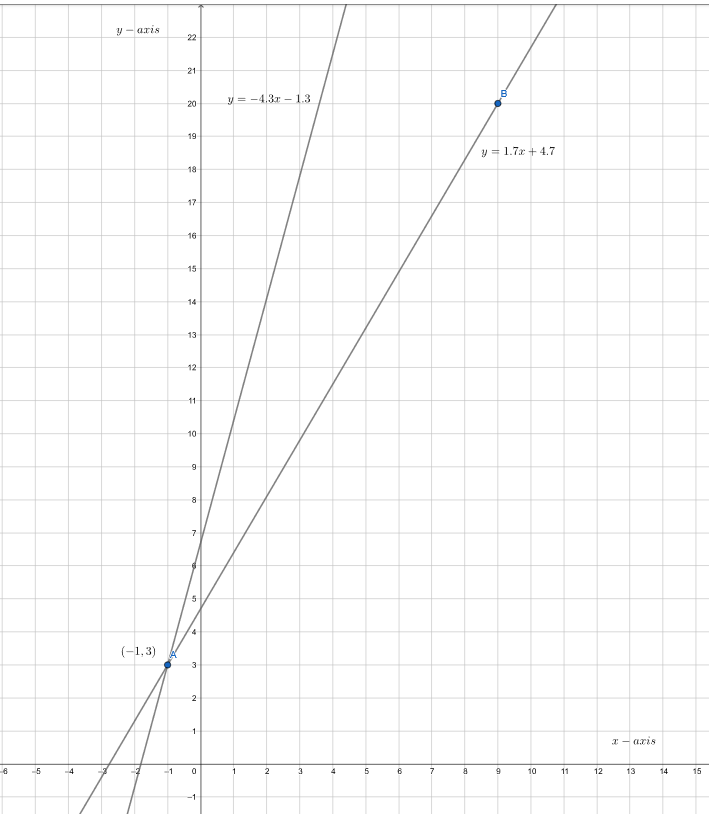
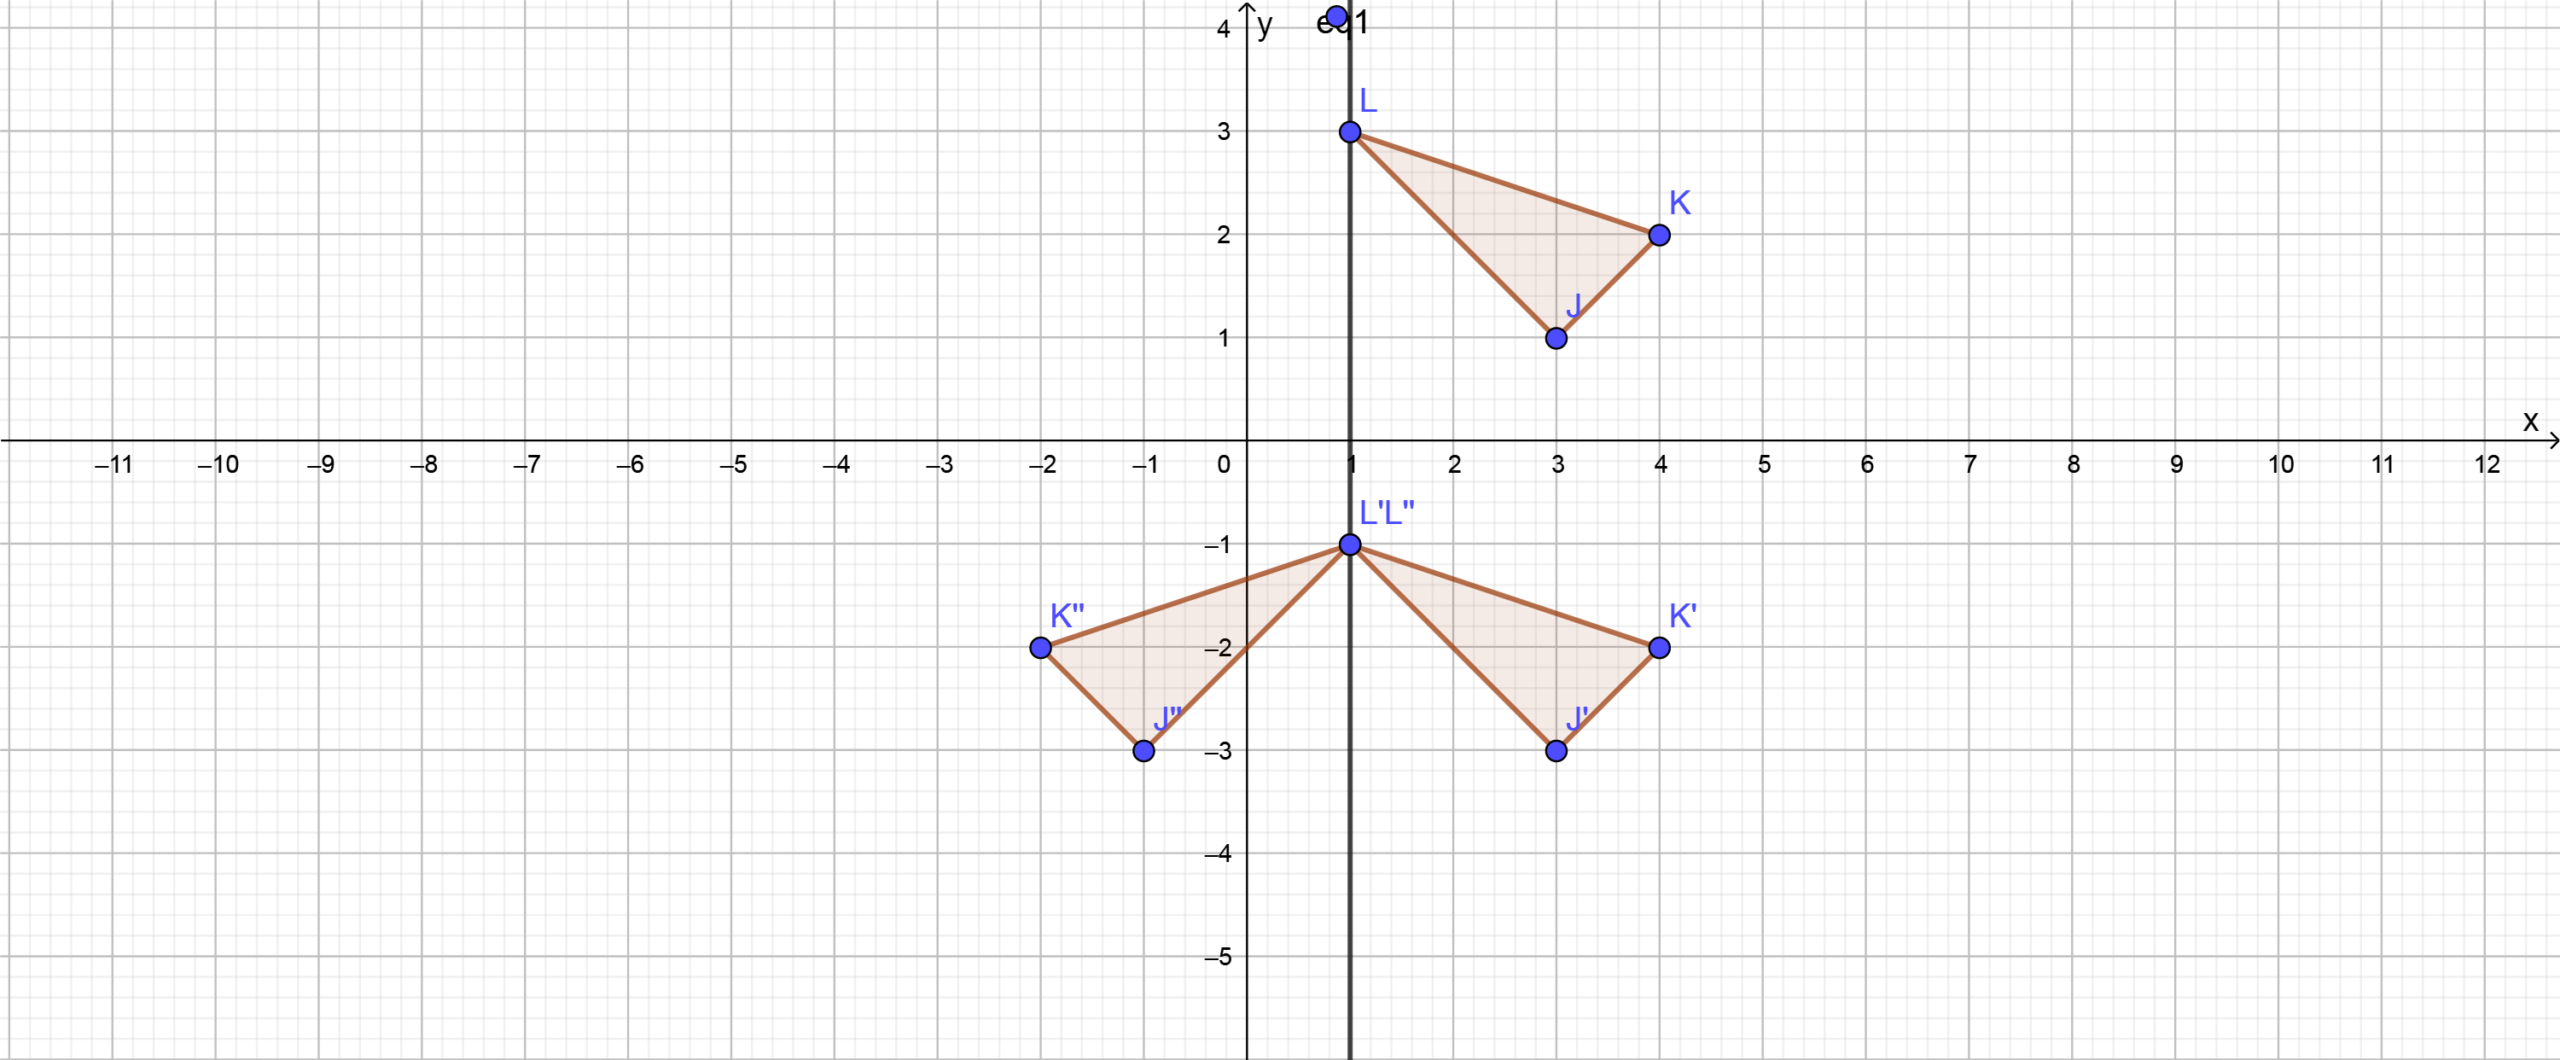
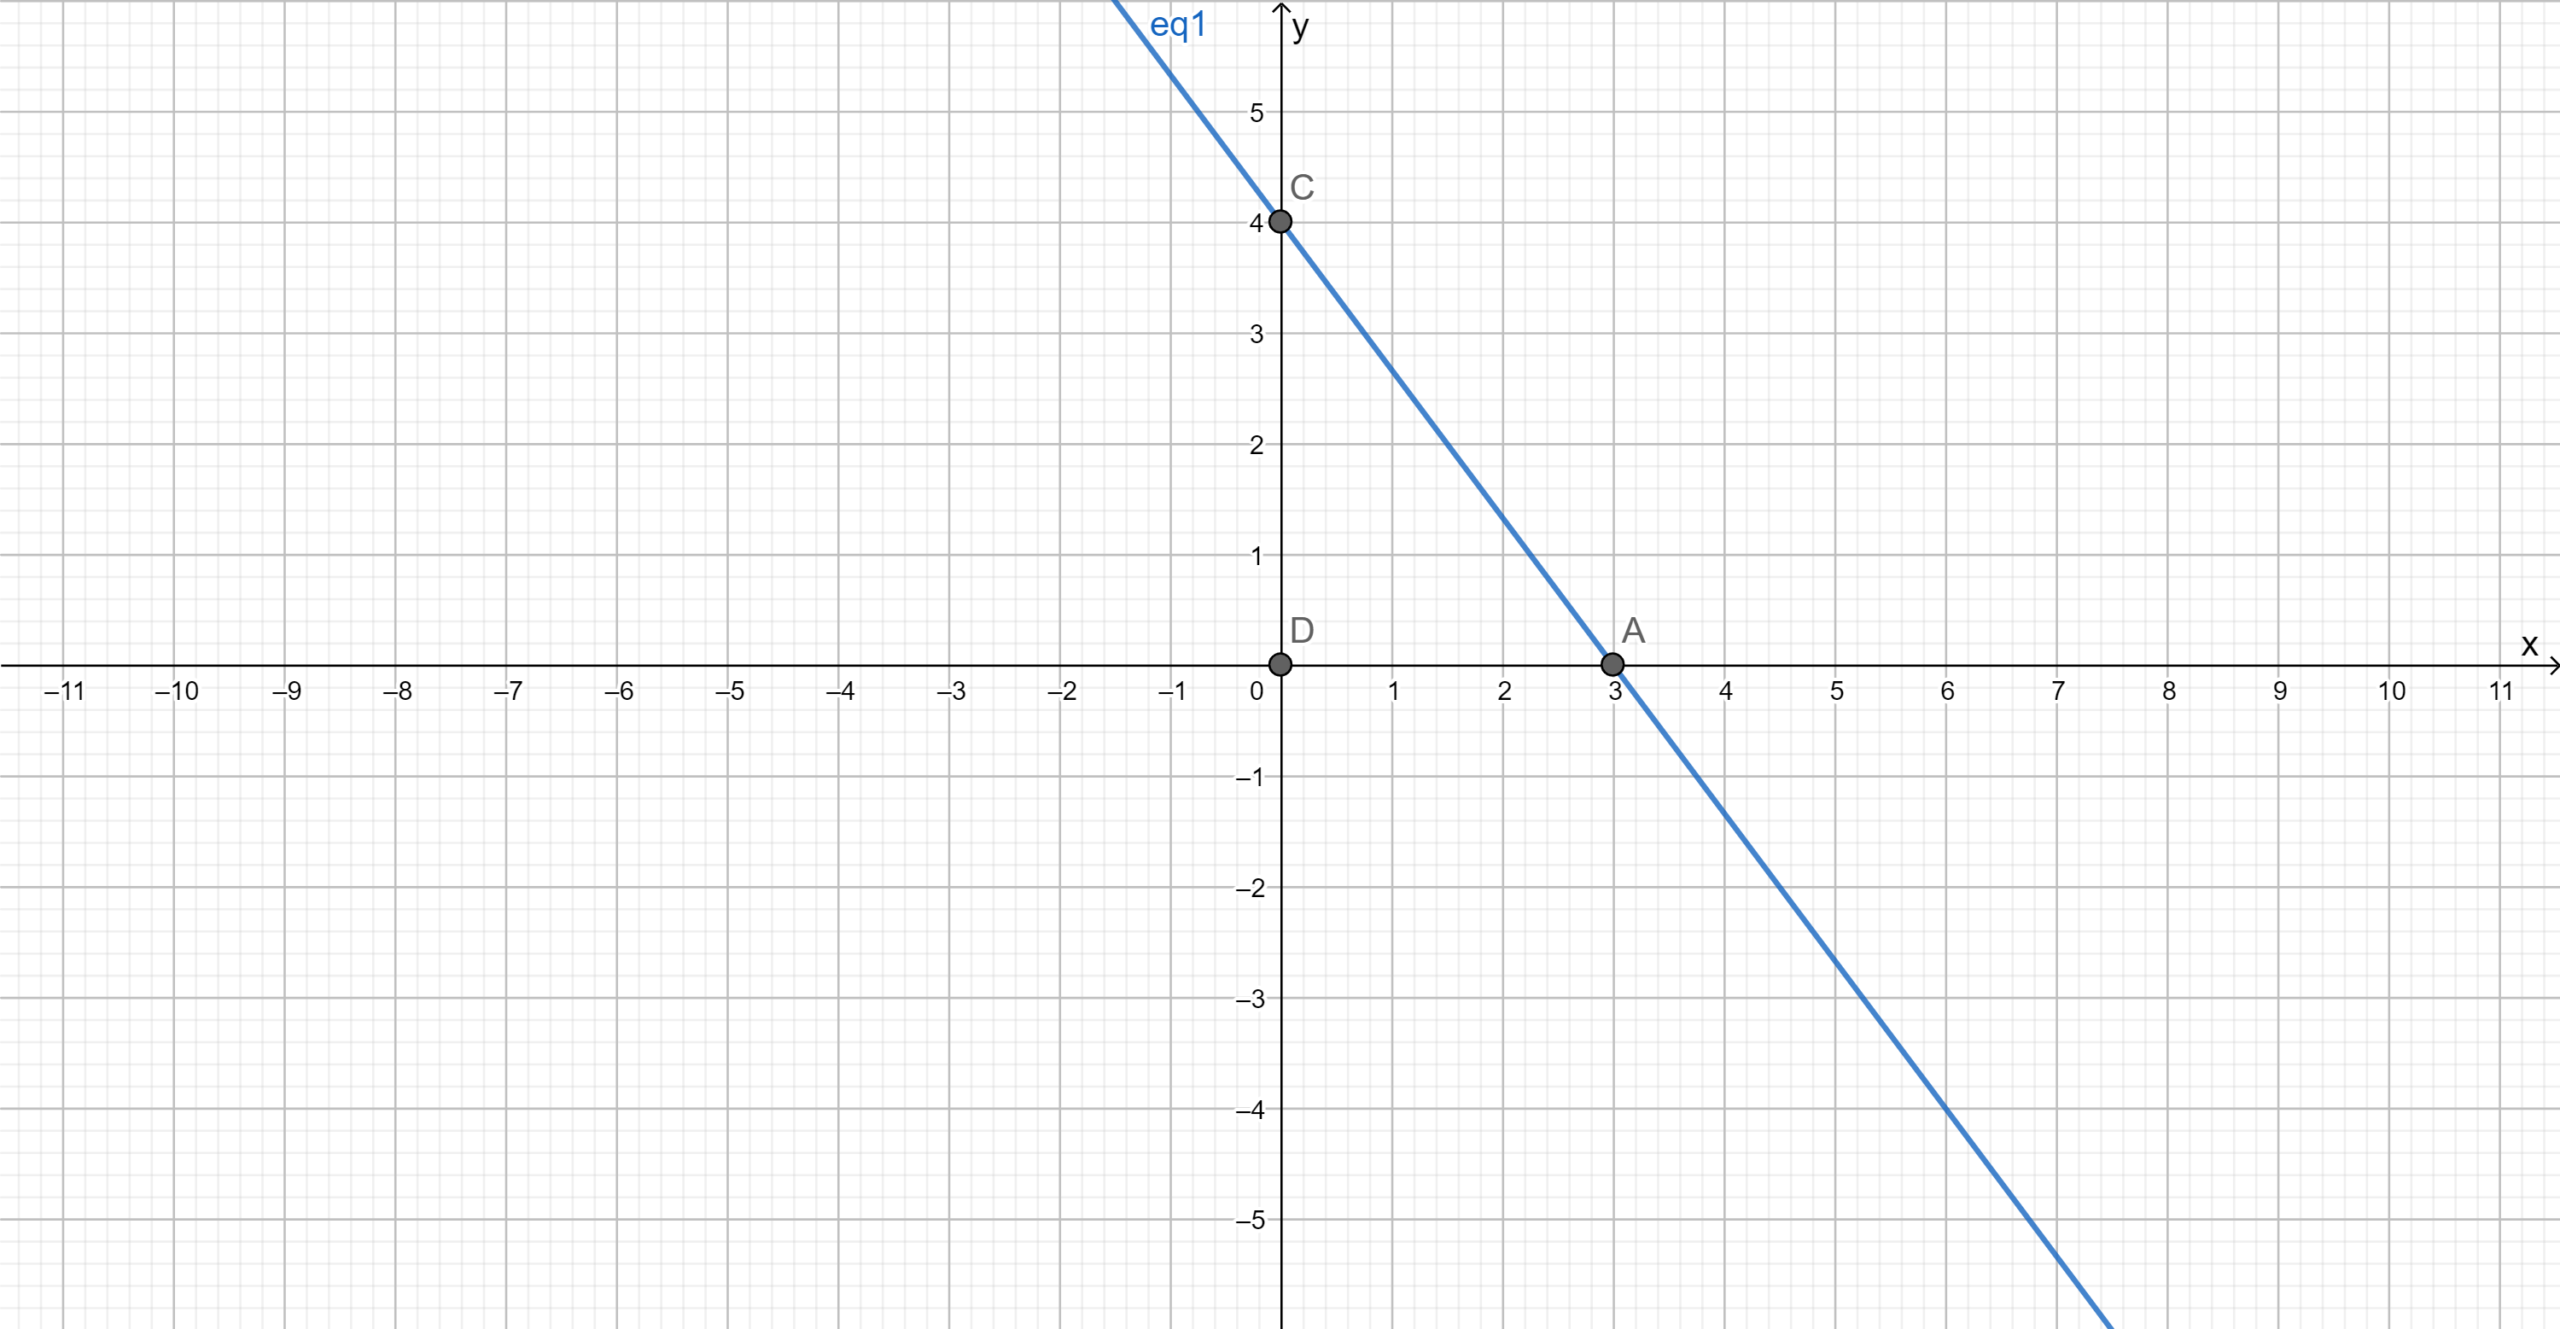
From the graph we can observe that both the lines intersect each other at A(−1,3).
Hence,(−1,3)is the solution of the equations.
(−1,3) is the solution of y = −4.3x−1.3 and y = 1.7x + 4.7 .
Page 123 Exercise 13 Problem 16
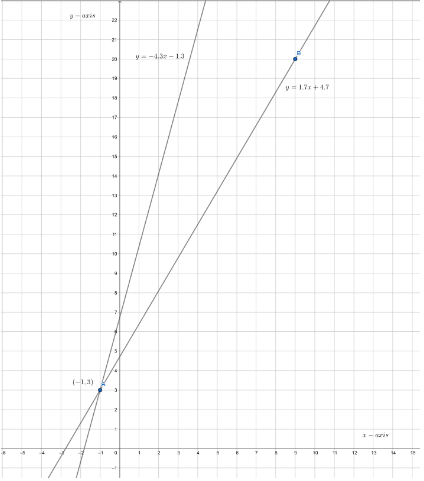
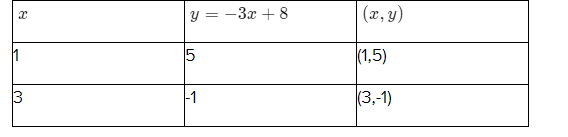
Question 16.
Given:
y=x (1)
y=-3 x+8 (2)
We will use the graphing method to solve the system.
Answer:
We have
y = x −−−———(1) and
y = −3x + 8 -−−− —–(2)
We will use graphing method to solve the system as it is easier to apply.
Find the points satisfying the given equation.
For equation (1)
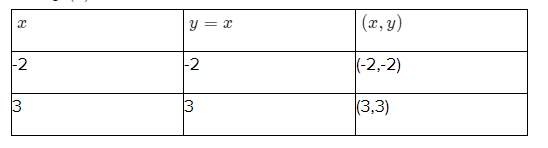
For equation (2)
Plot the graph.
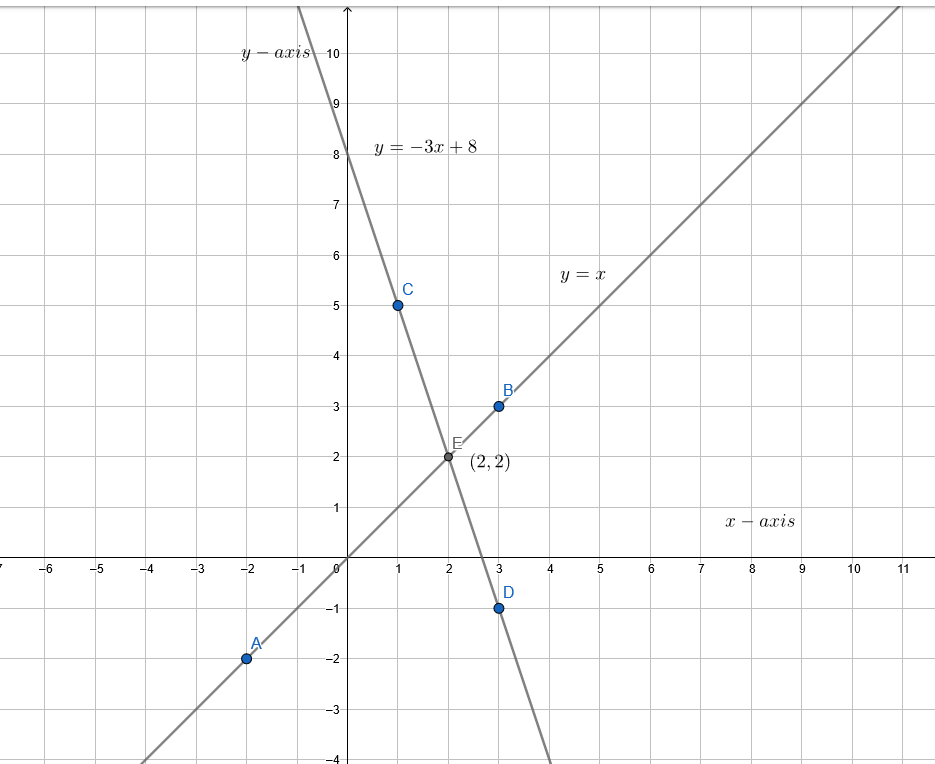
From the graph we can observe that both the lines intersect each other at E(2,2)
Hence,(2,2) is the solution of the equations.
(2,2) is the solution of y = x and y = −3x + 8
Page 123 Exercise 13 Problem 17
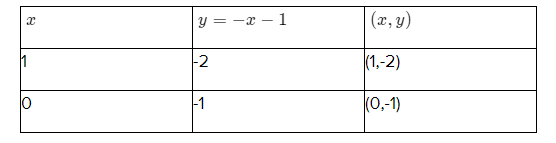
Question 17.
Given:
y=-x-1 (1)
y=3 x+5 (2)
We will use the graphing method to solve the system.
Answer:
We have
y = −x − 1 −−−—— (1) and
y = 3x + 5 −−−——- (2)
We will use graphing method to solve the system as it is easier to apply.
Find the points satisfying the given equation.
For equation (1)
For equation (1)
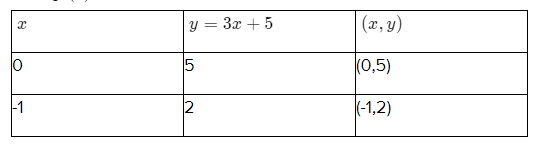
Plot the graph.
From the graph we can observe that both the lines intersect each other at E(\(\frac{-3}{2}\), \(\frac{1}{2}\)).
Hence,(\(\frac{-3}{2}\), \(\frac{1}{2}\))
(\(\frac{-3}{2}\), \(\frac{1}{2}\))is the solution of y = −x−1 and y = 3x + 5.
Chapter 5 Maintaining Mathematical Proficiency Explained Big Ideas Math Integrated Math 1 Page 125 Exercise 14 Problem 18
Question 18.
Given:
x+y=4 (1)
2 x-y=3 (2)
We have to solve the system of linear equations using both the substitution and elimination methods.
Answer:
We have
x + y = 4 −−−——(1)
2x − y = 3 −−−——(2)
For(x,y) = (3,1)
In equation x + y = 4 ———-(1)
x = 3
⇒ y = 4−3 = 1
In equation 2x − y = 3 ——-(2)
x = 3
⇒ y = 6−3
⇒ y = 3
⇒ y ≠ 1
Hence given pair is not a solution of linear equations as it does not satisfy the equation (2).
(1,3) is not a solution of the linear equation as it does not satisfy equation (2), where x + y = 4 and 2x − y = 3.
Page 125 Exercise 15 Problem 19
Question 19.
Given:
x-y=-2 (1)
2 x+y=5 (2)
We need to determine whether the point (1,3) is a solution to the system of linear equations.
Answer:
We have
x − y = −2 −−−——-(1)
2x + y = 5 −−−——(2)
For (x,y) = (1,3)
In equation x − y = −2 ————-(1)
x = 1
⇒ y = 1 + 2
⇒ y = 3
In equation 2x + y = 5 (2)
x = 1
⇒ y = 5 − 2 ⇒ y = 3
Hence given pair is a solution of linear equations as it satisfies both of the equations.
(1,3) is a solution of linear equations as it satisfies both of the equations., Where x − y = −2 and 2x + y = 5 .
Page 125 Exercise 16 Problem 20
Question 20.
Given:
y=x-2 (1)
y=-3 x+6 (2)
We need to determine whether the point (2,0) is a solution to the system of linear equations.
Answer:
We have
y = x − 2 −−−——-(1)
y = −3x + 6 −−−—-(2)
For (x,y) = (2,0)
In equation y = x − 2 ———-(1)
x = 2
⇒ y = 0
In equation y = −3x + 6 —– —–(2)
x = 2
⇒ y = −6 + 6
⇒ y = 0
Hence given pair is a solution of linear equations as it satisfies both of the equations.
(2,0)is a solution of linear equations as it satisfies both of the equations., Where y = x−2 and y = −3x + 6 .
Page 125 Exercise 17 Problem 21
Question 21.
Given:
3 x-2 y=-12 (1)
2 x+4 y=9 (2)
Verify if the point (−2,3) is a solution to the system.
Answer:
We have
3x − 2y = −12 −−−——(1)
2x + 4y = 9 −−−——(2)
For(x,y) = (−2,3)
In equation 3x − 2y = −12 ———–(1)
x = −2
⇒ y = \(\frac{−6 + 12}{2}\)
⇒ y = 3
In equation 2x + 4y = 9 ———–(2)
x =− 2
⇒ y =\(\frac{9+4}{4}\)
⇒ y = \(\frac{13}{4}\) ≠ 3
Hence given pair is not a solution of linear equations as it does not satisfy equation (2).
(−2,3) is not a solution of the linear equation as it does not satisfy equation (2), where 3x−2y = −12 and 2x + 4y = 9.
Page 125 Exercise 18 Problem 22
Question 22.
Given:
x-2 y=5 (1)
2 x+y=-5 (2)
Verify if (−1,-3) is a solution to the system.
Answer:
We have the graph of
x − 2y = 5 −−-−——– (1) and
2x + y = −5 −−−———(2)
From the graph, we can observe that(−1,−3) is the point of intersection for the given equations.
In equation(1)
x = −1
⇒ y = \(\frac{−1−5}{2}\)
⇒ y = −3
In equation (2)
x = −1
⇒ y = −5 + 2
⇒ y = −3
Hence,(−1,−3) is a solution of linear equations as it satisfies both of the equations.
The solution of the linear equations x − 2y = 5 and 2x + y = −5 is(−1,−3).
Page 126 Exercise 19 Problem 23
Question 23.
Given:
y=\(\frac{1}{2}\) x+2(1)
y=\(-\frac{1}{2}\) x+4 (2
Verify if (2,3) is a solution to the system:
Answer:
We have, y = \(\frac{1}{2}\) x + 2 −−−—- (1) and
y = − \(\frac{1}{2}\) x + 4 −−−—— (2)
Find the points satisfying the given equation.
For equation(1)
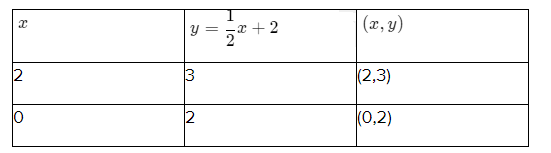
For equation(2)
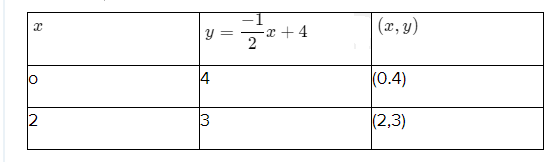
Plot the graph and find the solution.
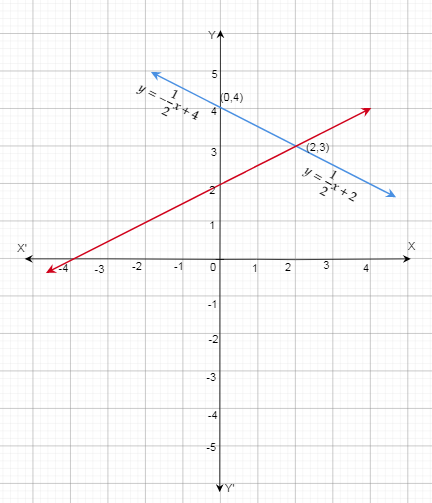
From the graph, we can observe that both lines intersect at point A(2,3).
Hence,(2,3) is the solution of linear equations.
(2,3) is the solution of y =\(\frac{1}{2}\) x + 2 and y = − \(\frac{1}{2}\) x + 4
Page 126 Exercise 20 Problem 24
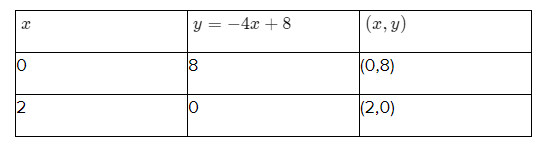
Question 24.
Given the system of linear equations:
y=4 x (1)
y=-4 x+8 (2)
- Verify if the point (2,8) is a solution to the system.
- Solve the system using the substitution method.
- Solve the system using the elimination method.
- Plot both equations and find the intersection point.
- Confirm the solution (1,4) by substituting it into both equations.
Answer:
We have
y = 4x −−−——(1) and
y = −4x + 8 −−−——(2)
We will find the points satisfying the given equation to plot the graph, by taking the value of x from R and obtaining the value of y corresponding to the value of x or vice versa.
Find the points satisfying the given equation.
For equation (1)
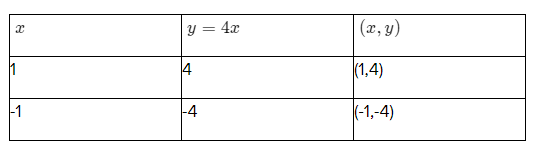
For equation (2)
Plot the graph and find the solution.
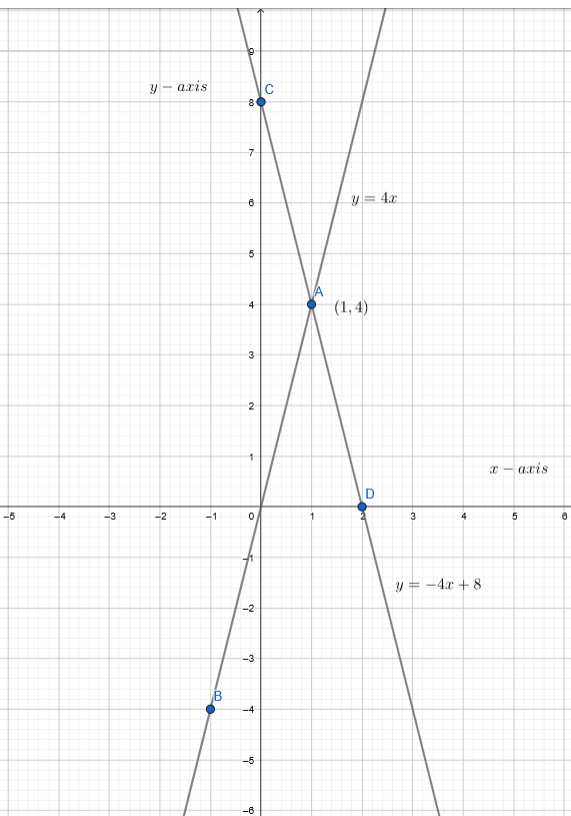
From the graph we can observe that both lines intersect at point A(1,4).
Hence,(1,4) is the solution of linear equations.
(1,4) is the solution of y = 4x and y = −4x + 8.
worked examples for Big Ideas Math Integrated Math 1 Chapter 5 Maintaining Mathematical Proficiency Page 126 Exercise 21 Problem 25
Question 25.
Given the system of linear equations:
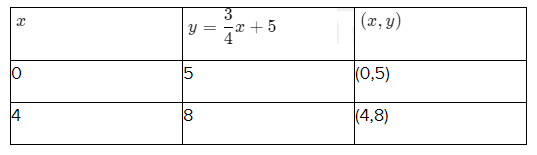
y=\(\frac{1}{4}\) x+3 (1)
y=\(\frac{3}{4}\) x+5 (2)
Answer:
We have
y = \(\frac{1}{4}\) x + 3 −−−——- (1) and
y = \(\frac{3}{4}\) x + 5 −−−—— (2)
We will find the points satisfying the given equation to plot the graph, by taking the value of x from R and obtaining the value of y corresponding to the value of x
or vice versa.
Find the points satisfying the given equation.
From equation (1)
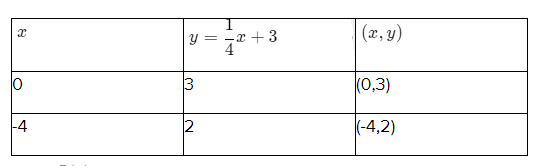
From equation (2)
Plot the graph and find the solution.
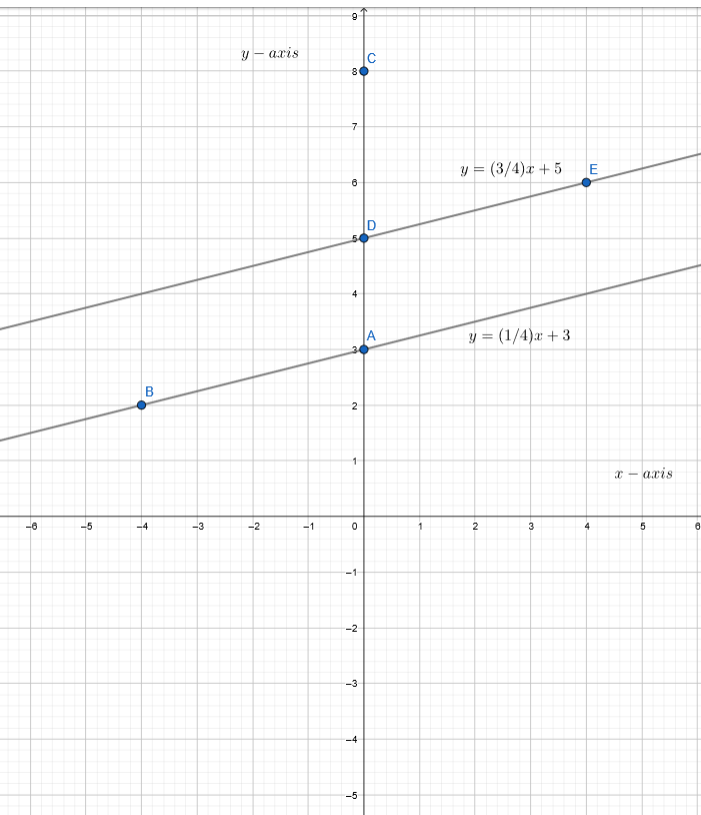
From the graph we can observe that both lines are parallel to each other.
Hence, the system of linear equations has no solution.
The system of linear equations, where y = \(\frac{1}{4}\) x + 3 and y = \(\frac{3}{4}\) x + 5 has no solution.
Page 126 Exercise 22 Problem 26
Question 26.
The test consists of x true-false questions and y multiple-choice questions. The test consists of a total of 20 questions, and the total score for the test is 100 points. True-false questions are worth 4 points each, and multiple-choice questions are worth 8 points each.
Answer:
Given:
The test consists of x true-false questions and y multiple-choice questions.
The test consists of a total of 20 questions.
⇒ x + y = 20 −−−—–(1)
The true-false questions worth 4 points and multiple-choice questions worth 8 points each.
A test has a total of 100 points.
⇒ 4x + 8y = 100 −−−—–(2)
From equation (1)
⇒ x + y = 20
⇒ y = 20 − x
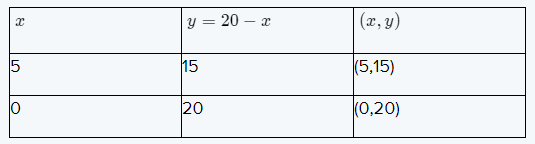
From equation (2)
⇒ 4x + 8y = 100
⇒ y = \(\frac{100-4x}{8}\)
The graph of the lines is:-
From the graph, we can observe that the point of intersection is (15,5).
Hence,(15,5) is the solution of the equations
Thus, there are total 15 true-false questions and 5 multiple choice questions in the test.
Page 127 Exercise 23 Problem 27
Question 27.
We can use the substitution method to solve a system of linear equations with two variables.
Substitution Method:
- Isolate any one variable from one of the equations.
- Substitute the isolated value into the other equation and solve for the second variable.
- Substitute the value of the second variable back into the first equation to find the value of the first variable.
Given system of equations:
x+y=2 (1)
x-y=0 (2)
Answer:
We can use any of the two methods to solve a system of linear equations with two variables: Substitution and Elimination.
Substitution: Apply the following steps to solve a system of linear equations.
Isolate any one variable from one of the equations.
Put the isolated value in the other equation and solve the resulting equation.
Put the value of the variable obtained from the resulting equation in any of the two equations and find the value of the other variable.i.e.
x + y = 2 −−−——(1)
x − y = 0 −−−——(2)
From equation (1)
⇒ x + y = 2
x = 2−y
Putting the value of x in equation (2), we get
(2−y) − y = 0
⇒ y = 1
x = 2− y
⇒ x = 2 − 1
⇒ x = 1
Hence,(1,1) is the solution of a given system of linear equations.
We can use Substitution by applying the following steps to solve a system of linear equations.
Big Ideas Math Integrated Math 1 Chapter 5 Detailed Answers Page 128 Exercise 24 Problem 28
Question 28.
We can choose a randomly ordered pair with integers between (−5,5).
Let’s say the ordered pair is (2,−1).
Given a system of linear equations:
3 x+y=7 (1)
x-2 y=1 (2)
Answer:
Given
3 x+y=7 (1)
x-2 y=1 (2)
We can choose a randomly ordered pair with integers between (−5,5).
We can use graphing calculator to find ordered pair.
One ordered pair between (-5, 5) is (-2, 3)
⇒ (−2,3) is solution of system of linear equations.
We can choose any random integers as (−1,3)
The ordered pair generated between (−5, 5)is (−1,3).
Page 128 Exercise 24 Problem 29
Question 29.
Choose a random ordered pair with integers between (−5,5).
One ordered pair between (−5,5) is (−1,3).
The system of linear equations which has the solution (−1,3) is given below:
x + y = 2(1)
-2x + 3y = 11(2)
We can solve the above system of equations using the substitution method.
Answer:
Given
x + y = 2(1)
-2x + 3y = 11(2)
We can choose random ordered pair with integers between (-5, 5).
We can use graphing calculator to find ordered pair.
One ordered pair between (-5, 5) is (-1, 3).
The system of linear equation which have solution as (-1, 3) are given below:
x + y = 2 ——— (1)
−2x + 3y = 11 ——— (2)
We can solve the above system of solution using substitution method.
Solving by method 1: Solve for x first solve for x in one of the equation.
Substitute the expression for x into another equation to find y.
Then substitute the value of y into one of the original equation to find value of x.
From equation (1)
⇒ x + y = 2
⇒ x = 2− y
Substituting the expression of x in equation (2) we get
−2x + 3y = 11
−2(2−y) + 3y = 11
⇒ −4 + 2y + 3y = 11
⇒ y = 3
Substituting y = 3 in equation (1) we get
x + 3 = 2
⇒ x = −1
Hence solution of system of linear equation are
x = −1
y = 3
The solution of system of equation are: x + y = 2 , −2x + 3y =11 , x = −1, y = 3
Page 128 Exercise 25 Problem 30
Question 30.
Using the substitution method to solve a system of linear equations involves the following steps:
- Isolate one variable in one of the equations.
- Substitute the isolated variable into the other equation and solve for the remaining variable.
- Substitute the value of the solved variable back into one of the original equations to find the other variable.
Given the system of linear equations:
x + y = 2(1)
x – y = 0(2)
Answer:
Given
x + y = 2(1)
x – y = 0(2)
We can use any of the two methods to solve a system of linear equations with two variables: Substitution and Elimination.
Substitution: Apply the following steps to solve a system of linear equations.
Isolate any one variable from one of the equations.
Put the isolated value in the other equation and solve the resulting equation.
Put the value of the variable obtained from the resulting equation in any of the two equations and find the value of the other variable. i.e.
x + y = 2 −−−—–(1)
x − y = 0 −−−—–(2)
From equation (1)
x = 2 − y
Putting the value of x in equation (2), we get
(2−y)− y = 0
⇒ y= 1
x = 2 − y
⇒ x = 2 − 1
⇒ x = 1
Hence,(1,1) is the solution of a given system of linear equations.
We can use Substitution by applying the following steps to solve a system of linear equations.
Big Ideas Math Integrated Math 1 Student Journal Chapter 5 Maintaining Proficiency Answers Page 130 Exercise 26 Problem 31
Question 31.
Given the system of equations:
x – 3x = -1(1)
x = y (2)
- Solve the system of equations using the substitution method:
- Isolate x in equation (2).
- Substitute the expression for x into equation (1) to find y.
- Substitute the value of y back into equation (2) to find x.
- Verify the solution by substituting the values of x and y into both equations (1) and (2).
Answer:
We have
x − 3y = −1 −−−——(1)
x = y −−−——— (2)
We will solve the given system of equations for x and y separately by isolating them separately from the given equations.
Solve the equations for x.
From equation (1), we get
x − 3y = −1
x = −1 + 3 y
Substituting the value of x in equation (2), we get
x = y
−1 + 3y = y
⇒ y = \(\frac{1}{2}\)
Hence,x = −1 + 3 (\(\frac{1}{2}\))
⇒ x = \(\frac{1}{2}\)
The solution of a given system of equations is( \(\frac{1}{2}\), \(\frac{1}{2}\))
Solve the equations for y.
From equation (1), we get
y =\(\frac{x+1}{3}\)
Substituting the value of y in equation(2), we get
x = \(\frac{x+1}{3}\)
⇒ x = \(\frac{1}{2}\)
Hence
y = \(\frac{\frac{1}{2}+1}{3}\)
⇒ y = \(\frac{1}{2}\)
The solution of a given system of equations is (\(\frac{1}{2}\),\(\frac{1}{2}\))
(\(\frac{1}{2}\),\(\frac{1}{2}\)) is the solution of x − 3y = −1 and x = y.
Page 130 Exercise 27 Problem 32
Question 32.
Solve the given system of equations using the substitution method:
x – 2y = -3(1)
y = x + 1(2)
- Solve the system of equations using substitution:
- Isolate x in equation (1).
- Substitute the expression for x into equation (2) to find y.
- Substitute the value of y back into equation (1) to find x.
- Verify the solution by substituting the values of x and y into both equations (1) and (2).
Answer:
We have
x − 2y = −3 −−−—–(1)
y = x + 1 −−−——-(2)
We will solve the given system of equations for x and y separately by isolating them separately from the given equations.
Solve the equations for x.
From equation (1), we get
x = −3 + 2y
Substituting the value of x in equation (2), we get
y = −3 + 2y + 1
⇒ y = 2
Hence,x =−3 + 4
⇒ x = 1
The solution of a given system of equations is (1,2).
Solve the equations for y.
From equation(1) , we get y = \(\frac{x+3}{2}\)
Substituting the value of y in equation (2), we get
\(\frac{x+3}{2}\) = x + 1
⇒ x + 3 = 2x + 2
⇒ x = 1
Hence,y = \(\frac{1+3}{2}\)
⇒ y = 2
The solution of a given system of equations is (1,2).
(1,2) is the solution of x − 2y = −3 and y = x + 1.
Page 130 Exercise 28 Problem 33
Question 33.
Solve the given system of equations using the substitution method:
2x + y = 3(1)
x = 3y + 5(2)
- Solve the system of equations using substitution:
- Isolate x in equation (1).
- Substitute the expression for x into equation (2) to find y.
- Substitute the value of y back into equation (1) to find x.
- Verify the solution by substituting the values of x and y into both equations (1) and (2).
Answer:
We have
2x + y = 3 −−−——(1)
x = 3y + 5 −−−——(2)
We will solve the given system of equations for x and y separately by isolating them separately from the given equations.
Solve the equations for x.
From equation(1) , we get
x = \(\frac{3−y}{2}\)
Substituting the value of x in equation (2), we get
\(\frac{3−y}{2}\)
= 3y + 5
⇒ 3 −y = 6y + 10
⇒ y =−1
Hence,x = \(\frac{3+1}{2}\)
⇒ x = 2
The solution of a given system of equations is (2,−1).
Solve the equations for y.
From equation (1), we get
y = 3 − 2x
Substituting the value of y in equation (2), we get
x = 3(3−2x)+ 5
⇒ x = 14 − 6x
⇒ x = 2
Hence, y = 3−4
⇒ y = −1
The solution of a given system of equations is (2,−1)
(2,-1) is the solution of 2x + y = 3 and x = 3y + 5.
Page 130 Exercise 29 Problem 34
Question 34.
Solve the given system of equations using the substitution method:
3x + y = 5(1)
y = 2x + 5(2)
- Solve the system of equations using substitution:
- Isolate x in equation (1).
- Substitute the expression for x into equation (2) to find y.
- Substitute the value of y back into equation (1) to find x.
- Verify the solution by substituting the values of x and y into both equations (1) and (2).
Answer:
We have
3x + y = −5 −−−—–(1)
y = 2x + 5 −−−——(2)
We will solve the given system of equations for x and y separately by isolating them separately from the given equations.
Solve the equations for x.
From equation (1), we get
x = \(\frac{−5−y}{3}\)
Substituting the value of x in equation (2), we get
y = \(\frac{2(−5−y)}{3}\) + 5
⇒ 3y = 5 − 2y
⇒ y = 1
Hence,x = \(\frac{−5−1}{3}\)
⇒ x = −2
The solution of a given system of equations is(−2,1)
Solve the equations for y.
From equation (1), we get y = −5−3x
Substituting the value of y in equation (2), we get
−5−3x = 2x + 5
⇒ x = −2
Hence,y = −5−3(−2)
⇒ y = 1
The solution of a given system of equations is(−2,1)
(−2,1) is the solution of 3x + y = −5 and y = 2x + 5
Page 130 Exercise 30 Problem 35
Question 35.
Solve the given system of equations using the substitution method:
y = 2x + 8(1)
y = -2x(2)
- Solve the system of equations using substitution:
- Isolate x in equation (1).
- Substitute the expression for x into equation (2) to find y.
- Substitute the value of y back into equation (1) to find x.
- Verify the solution by substituting the values of x and y into both equations (1) and (2).
Answer:
We have
y = 2x + 8 -−−−—–(1)
y = −2x −−−——-(2)
We will solve the given system of equations for x and y separately by isolating them separately from the given equations.
Solve the equations for x.
From equation (1), we get
x = \(\frac{y−8}{2}\)
Substituting the value of x in equation (2), we get
y = −(y−8)
⇒ y = 4
Hence,x = \(\frac{4−8}{2}\)
⇒ x = −2
The solution of a given system of equations is(−2,4)
Solve the equations for y.
From equation (1), we get
y = 2x + 8
Substituting the value of y in equation(2), we get
2x + 8 = −2x
⇒ x = −2
Hence,y = 2(−2)+ 8
⇒ y = 4
The solution of a given system of equations is(−2,4)
(−2,4) is the solution of y = 2x + 8 and y = −2x .
Page 130 Exercise 31 Problem 36
Question 36.
Solve the given system of equations using the substitution method:
2x – 3y = 0(1)
y = 4(2)
- Solve the system of equations using substitution:
- Isolate x in one of the equations if necessary
- Substitute the expression for y from one equation into the other equation to find x.
- Substitute the value of x back into one of the original equations to find y.
- Verify the solution by substituting the values of x and y into both equations (1) and (2).
Answer:
We have
2x − 3y = 0 −−−—–(1)
y = 4 −−−——(2)
We will solve the given system of equations for x and y separately by isolating them separately from the given equations.
Solve the equations for x.
From equation(1) , we get
⇒ 2x − 3y = 0
x = \(\frac{3y}{2}\)
From equation (2), we get
y = 4
Hence,x = \(\frac{3(4)}{2}\)
⇒ x = 6
The solution of a given system of equations is(6,4).
Solve the equations for y.
From, equation (1), we get
⇒ 2x − 3y = 0
y = \(\frac{2x}{3}\)
Substituting the value of y in equation (2), we get
\(\frac{2x}{3}\) = 4
⇒ x = 6
Hence,y = \(\frac{2(6)}{3}\)
⇒ y = 4
The solution of a given system of equations is(6,4).
(6,4) is the solution of 2x−3y = 0 and y = 4 .
Page 131 Exercise 32 Problem 37
Question 37.
Solve the given system of equations using the substitution method:
y = 12 x + 1 (1)
y = -12 x -9 (2)
- Solve the system of equations using substitution:
- Isolate x in one of the equations if necessary
- Substitute the expression for y from one equation into the other equation to find x.
- Substitute the value of x back into one of the original equations to find y.
- Verify the solution by substituting the values of x and y into both equations (1) and (2).
Answer:
y = \(\frac{1}{2}\) x + 1 ———(1)
y = \(\frac{-1}{2}\) x + 9 −−−——–(2)
We will solve the given system of equations for x and y separately by isolating them separately from the given equations.
Solve the equations for x
From equation (1), we get
x = 2(y−1)
Substituting the value of x in equation (2), we get
y =−(y−1) + 9
⇒ y = 5
Hence, x = 2(5−1)
⇒ x = 8
The solution of a given system of equations is(8,5)
Solve the equations for y
From equation(1), we get
y = \(\frac{1}{2}\) x + 1
Substituting the value of y in equation (2), we get
\(\frac{1}{2}\) x + 1 = \(\frac{ −1}{2}\) x + 9
⇒ x = 8
Hence, y = 4 + 1
⇒ y = 5
The solution of a given system of equations is (8,5)
(8,5) is the solution of y = \(\frac{1}{2}\) x + 1 and y = \(\frac{-1}{2}\) x + 9.
Page 131 Exercise 33 Problem 38
Question 38.
Given the system of equation:
7x – 4y = 8 (1)
5x – y = 2 (2)
Solve the given system of equations using the substitution method.
- Isolate one variable from one of the equations.
- Substitute the isolated value in the other equation and solve the resulting equation.
- Substituting the value of the variable obtained from the resulting equation in any of the two equations and find the value of the other variable.
- Verify the solution by substituting the values of (x) and (y) into both equations (1) and (2).
Answer:
We have
7x − 4y = 8 −−−——(1)
5x − y = 2 −−−——–(2)
We will solve the given system of equations for x and y separately by isolating them separately from the given equations.
Solve the equations for x
From equation (1), we get
⇒ 7x − 4y = 8
x = \(\frac{8+4y}{7}\)
Substituting the value of x in equation (2), we get
\(\frac{5(8+4y)}{7}\) −y = 2
⇒ 20y + 40−7y = 14
⇒ 13y + 40 = 14
⇒ 13y = 14−40
⇒ 13y = −26
⇒ y = \(\frac{−26}{13}\)
⇒ y = −2
Hence, x =\(\frac{8+4×{−2}}{7}\)
=\(\frac{8−8}{7}\)
⇒ x = 0
The solution of a given system of equations is x = 0,y = −2
Check my answer is correct or not.
When we check the answer is correct or not, this time we check the answer satisfies the given equation or not.
For equation number (1)
L.H.S. 7 × 0 − 4 × (−2)
= 8
= RHS.
For equation number (2)
L.H.S. 5 × 0 − (−2)
= 2
= RHS.
Therefore x = 0,y =−2 satisfies both equations, then the answer is correct.
x = 0,y = −2 is the solution for 7x−4y = 8 and 5x−y = 2 .
Page 131 Exercise 34 Problem 39
Question 39.
We have the system of equations:
y 35x – 12 (1)
y = 18x – 8 (2)
We will solve the given system of equations for (x) and (y) separately by isolating them separately from the given equations.
Answer:
We have
y = \(\frac{3}{5}\) x−12 −−−—– (1)
y = \(\frac{1}{8}\) x−8 −−−——- (2)
We will solve the given system of equations for x and y separately by isolating them separately from the given equations.
Solve the equations for x
From equation (1), we get
x = \(\frac{5(y+12)}{3}\)
Substituting the value of x in equation (2), we get
y = \(\frac{5(y+12)}{9}\) − 8
⇒ 9y = 5y − 12
⇒ y = −3
Hence, x = \(\frac{5(−3+12)}{3}\)
⇒ x = 15
The solution of a given system of equations is(15,−3)
Solve the equations for y
From equation (1), we get
y = \(\frac{3}{5}\) x−12
Substituting the value of y in equation (2), we get
\(\frac{3}{5}\) x−12 = \(\frac{1}{8}\) x−8
⇒ 3(3x−60) = 5(x−24)
⇒ x = 15
Hence, y = 9 − 12
⇒ y = −3
The solution of a given system of equations is (15,−3)
(15,−3) is the solution of y = \(\frac{3}{5}\) x − 12 and y = \(\frac{1}{8}\) x− 8.
Page 131 Exercise 35 Problem 40
Question 40.
Given the system of equations:
3x – 4y = -1(1)
5x + 2y = 7(2)
Solve the system of equations using both the substitution and elimination methods. Verify your solutions by substituting the values back into the original equations.
Answer:
We have
3x − 4y = −1 −−−— (1)
5x + 2y = 7 −−−—– (2)
We will solve the given system of equations for x and y separately by isolating them separately from the given equations.
Solve the equations for x.
From equation(1) , we get
x = \(\frac{−1+4y}{3}\)
Substituting the value of x in equation (2), we get
\(\frac{5(−1+4y)}{3}\) + 2y = 7
⇒ 26y−5 = 21
⇒ y = 1
Hence x = \(\frac{−1+4}{3}\)
⇒ x = 1
The solution of a given system of equations is (1,1)
Solve the equations for y.
From equation (1), we get
y = \(\frac{3x+1}{4}\)
Substituting the value of y in equation (2), we get
5x + \(\frac{3x+1}{2}\) = 7
⇒ 13x + 1 = 14
⇒ x = 1
Hence,y = \(\frac{3+1}{4}\)
⇒ y−1
The solution of a given system of equations is(1,1)
(1,1) is the solution of 3x−4y = −1 and 5x + 2y = 7.
Page 131 Exercise 36 Problem 41
Question 41.
Given:
4x – 8y = 3 (1)
8x + 4y = 1 (2)
We will solve the given system of equations for (x) and (y) separately by isolating them from the given equations.
Answer:
We have
4x − 8y = 3 −−−—— (1)
8x + 4y = 1 −−−—- (2)
We will solve the given system of equations for x and y separately by isolating them separately from the given equations.
Solve the equations for x.
From equation (1), we get
x = \(\frac{3+8y}{4}\)
Substituting the value of x in equation (2), we get
2(3 + 8y) + 4y = 1
⇒ 6 + 20y = 1
⇒ y = \(\frac{−1}{4}\)
Hence, x = \(\frac{3−2}{4}\)
⇒ x = \(\frac{1}{4}\)
The solution of a given system of equations is( \(\frac{1}{4}\),\(\frac{−1}{4}\))
Solve the equations for y.
From equation (1), we get
y = \(\frac{4x−3}{8}\)
Substituting the value of y in equation (2), we get
8x + \(\frac{4x−3}{2}\) = 1
⇒ 16x + 4x − 3 = 2
⇒ x = \(\frac{1}{4}\)
Hence, y = \(\frac{1−3}{8}\)
⇒ y = \(\frac{−1}{4}\)
The solution of a given system of equations is(\(\frac{1}{4}\),\(\frac{−1}{4}\) ).
(\(\frac{1}{4}\),\(\frac{−1}{4}\) )is the solution of 4x−8y = 3and 8x + 4y = 1.
Page 131 Exercise 37 Problem 42
Question 42.
Given:
The cost of a children’s ticket is (x)
The cost of an adult’s ticket is (y)
We have the following conditions:
- A museum ticket $3 more than a children’s ticket: y = x + 3
- When 200 adult tickets and 100 children’s tickets are sold, the total revenue is $2100: 200y + 100x = 2100
Answer:
Suppose the cost of a children’s ticket is x and of an adult’s ticket is y at a museum.
A museum costs $3 more than a children’s ticket
⇒ y = x + 3 −−−—–(1)
When 200 adult tickets and 100 children’s tickets are sold, the total revenue is $2100.
⇒ 200y + 100x = 2100 −−−—-(2)
Putting the value of equation (1) in equation (2)
⇒ 200(x+3) + 100x = 2100
⇒ 300x = 1500
⇒ x = 5
Hence, the cost of a children’s ticket is $5.