Big Ideas Math Integrated Math Chapter 3 Maintaining Mathematical Proficiency
Page 58 Exercise 1 Problem 1
Question 1.
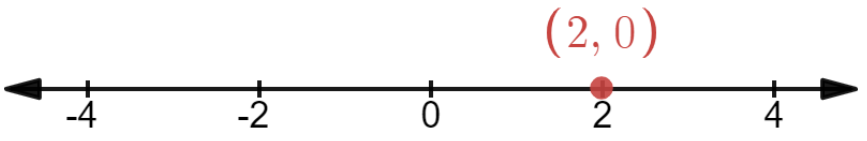
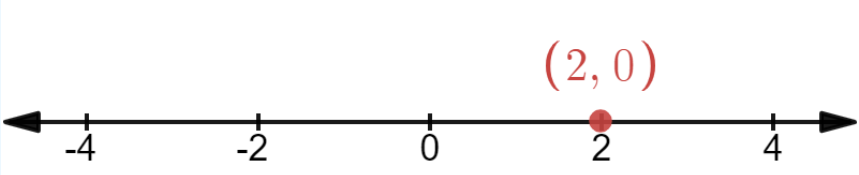
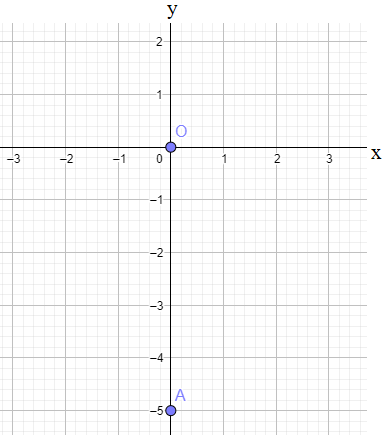
Plot the point on a coordinate plane that is on the y-axis and 5 units down from the origin.
Answer:
To find- plotting of a point that is on the y− axis and 5 units down from the origin.
Using property of coordinate plane we will plot required point.
∵ Required point is on the y− axis and 5 units down the origin.

Here point O is the origin and point A is our required point having coordinate b (0,−5).
Read and Learn More Big Ideas Math Integrated Math 1 Student Journal Solutions
The final answer is that the plotting of the point which is on the y− axis and 5 units down the origin is
Big Ideas Math Integrated Math 1 Student Journal Chapter 3 Solutions Page 58 Exercise 2 Problem 2
Question 2.
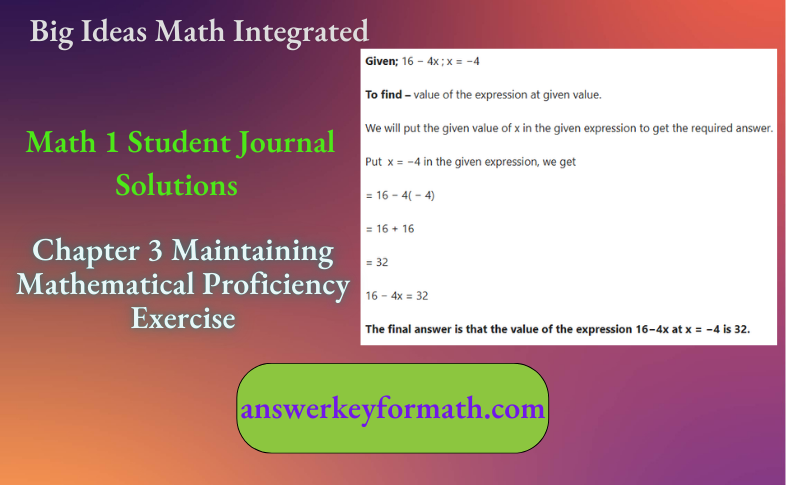
Evaluate the expression 16 – 4x at x = -4.
Answer:
Page 58 Exercise 3 Problem 3
Question 3.
Evaluate the expression 12x + 7 at x = -2.
Answer:
Given: 12 x + 7; x = −2
To find- value of the expression at given value.
We will put the given value of x in the given expression to get the required answer.
Put x = −2 in the given expression, we get
= 12(−2) + 7
=− 24 + 7
= − 17.
12 x + 7 = − 17.
The final answer is that the value of the expression 12x + 7 at x = −2 is−17.
Page 58 Exercise 4 Problem 4
Question 4.
Evaluate the expression -9- 3x at x = 5.
Answer:
Given: −9−3x ; x = 5
To find- value of the expression at given value.
We will put the given value of x in the given expression to get the required answer.
Put x = 5in the given expression, and we get
= −9−3(5)
=−9−15
= −24.
−9−3x = −24.
The final answer is that the value of the expression −9 − 3x at x = 5 is−24.
Chapter 3 Maintaining Mathematical Proficiency Solutions Big Ideas Math Integrated Math 1 Page 59 Exercise 5 Problem 5
Question 5.
\(\begin{array}{|l|l|}\hline x & y \\
\hline 1 & 8 \\
\hline 2 & 8 \\
\hline 3 & 8 \\
\hline 4 & 8 \\
\hline
\end{array}\)
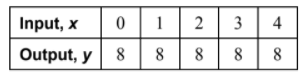
Determine whether the given relation represents a function.
Answer:
Given: An input-output table
To find- Whether the given relation represents a function.
From the given input-output table, we can see that all the values of x is related with element 8 of y
⇒ Every element of x is related with exactly one element of y.
⇒ The given relation is a function.
The final answer is that the given relation
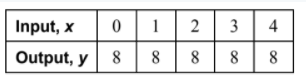
Is a function.
Page 59 Exercise 5 Problem 6
Question 6.
Given the input-output table below:
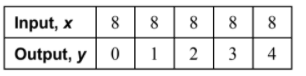
\(\begin{array}{|l|l|}\hline x & y \\
\hline 8 & 0 \\
\hline 8 & 1 \\
\hline 8 & 2 \\
\hline 8 & 3 \\
\hline 8 & 4 \\
\hline
\end{array}\)
Determine whether the given relation represents a function.
Answer:
Given: An input-output table
To find- Whether the given relation represents a function.
From the given input-output table, we can see that a single element of x i.e. 8 is related with more than one element of y i.e. 0,1,2,3 and 4.
⇒ Element of x is related with multiple element of y.
⇒ The given relation is not a function.
The final answer is that the given relation

Is not a function.
Big Ideas Math Integrated Math 1 Chapter 3 Step-By-Step Solutions Page 59 Exercise 5 Problem 7
Question 7.
Given the input-output table below:
\(\begin{array}{|l|l|}\hline x & y \\
\hline 1 & 10 \\
\hline 2 & 11 \\
\hline 3 & 10 \\
\hline 3 & 11 \\
\hline 4 & 12 \\
\hline
\end{array}\)
Determine whether the given relation represents a function.
Answer:
Given: An input-output table

To find- whether the given relation represents a function.
From the given input-output table, we can see that there is an element of x i.e.3 which is related to two elements of y i.e.10and 11.
⇒ There is an element in x which is related to multiple elements in y.
⇒ The given relation is not a function.
The final answer is that the
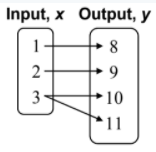
Is not a function.
Page 59 Exercise 5 Problem 8
Question 8.
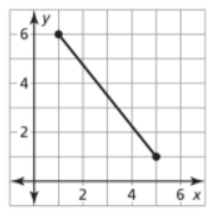
Analyze the given graph to determine whether the relation it represents is a function:
Determine whether the given relation represents a function.
Answer:
Given: A graph representing a relation

To find- whether the given relation represents a function.
From the given graph, we can easily see that there is an element of x i.e.5 which is related to two elements of y i.e.4 and 5.
⇒ There is an element in xwhich is related to multiple elements in y.
⇒ The given relation is not a function.
The final answer is that the given relation
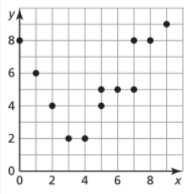
Is not a function.
Page 59 Exercise 5 Problem 9
Question 9.
Given the set of ordered pairs (-2,5), (-1,8), (0,6), (1,6), and (2,7), determine whether the relation represents a function.
Answer:
Given: (−2,5),(−1,8),(0,6),(1,6),(2,7)
We have to determine whether each given relation represents a function.
Since x− coordinates represent input and y−Coordinates represent the output of the relation.
Arrange the given relation
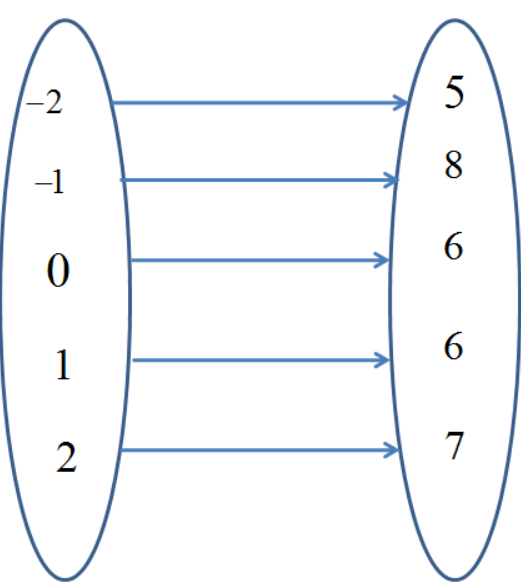
From above we can see that each input has exactly one output.
Hence, the given relation represents a function.
The given relation (−2,5),(−1,8),(0,6),(1,6),(2,7) represents a function. Since each input has unique output.
Page 59 Exercise 5 Problem 10
Question 10.
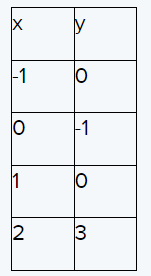
Given the set of ordered pairs (-2,0), (-1,0), (-1,1), (0,1), (1,2), and (2,2), determine whether the relation represents a function.
Answer:
Given: (−2,0),(−1,0),(−1,1),(0,1),(1,2),(2,2)
We have to determine whether each given relation represents a function.
Since x-coordinates represent input and y-coordinates represent the output of the relation.
(−2,0),(−1,0),(−1,1),(0,1),(1,2),(2,2) [Given relation]
In we can see that in the above-given relation input −1 has two outputs which are 0 and 1.
But a relation to be a function, each input has exactly one output.
which does not satisfy here in the given relation.
Hence, the given relation does not represent a function.
The given relation (−2,0),(−1,0),(−1,1),(0,1),(1,2),(2,2) does not represent a function because in the given relation input −1 have two output 0 and 1.
Solutions For Big Ideas Math Integrated Math 1 Chapter 3 Maintaining Mathematical Proficiency Exercises Page 60 Exercise 6 Problem 11
Question 11.
Determine whether each of the following relations represents a function. Explain your reasoning.
- Relation 1: (2,6), (2,7), (1,8), (3,6)
- Relation 2: (1,3), (2,5), (4,7)
Answer:
Function:
It is a rule in which for an input we get an output.
An important condition for the function is that for an input, x there should not be more than one different output.
Example of a function: y = x3
Example of not a function: (2,6)(2,7),(1,8),(3,6)
A relation is a function where each input has exactly one output. Example of a function:(1,3),(2,5),(4,7)
Page 60 Exercise 6 Problem 12
Question 12.
Determine whether each of the following relations represents a function. Explain your reasoning.
- Given the equation, y = 2x3, determine if it represents a function.
- Given the set of ordered pairs (2,6), (2,7), (1,8), and (3,6), determine if it represents a function.
Answer:
Function:
It is a rule in which for an input we get an output.
An important condition for the function is that for an input, x there should not be more than one different output,y.
Example of a function: y = 2x3
Example of not a function: (2,6)(2,7),(1,8),(3,6)
A relation is a function where each input has exactly one output. Example of not a function: (2,6)(2,7),(1,8),(3,6)
Page 63 Exercise 7 Problem 13
Question 13.
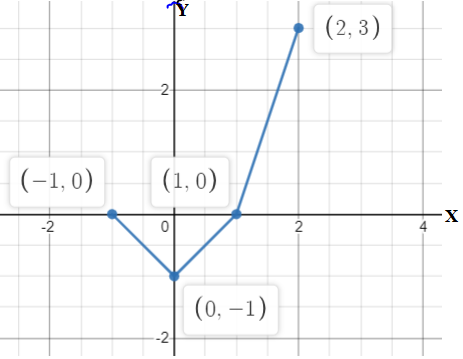
Given the graph below, determine whether the relation it represents is a function. Use the vertical line test to justify your answer.
Answer:
Given: The graph
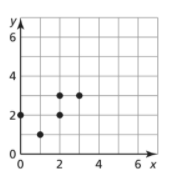
We have to find that the given graph represents a function or not.
Here, we use the vertical line test to check the given graph is a function or non-function.
From the graph, we can see that the input x = 2 has two different outputs y = 2 and y = 3
Also, by using the vertical line test draw a vertical line from x = 2 in the given graph
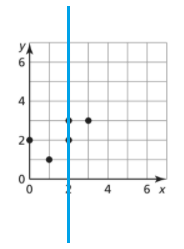
Here, the line pass through two points i.e y = 2 and y = 3.
Which does not satisfy the condition of function.
Hence, the given graph is not a function.
The given graph does not represent a function since it does not satisfy the condition of a function because when a vertical line is drawn it will pass through more than one point i.e. two points which can be shown in the below graph.

Big Ideas Math Integrated Math 1 Student Journal Chapter 3 Guide Page 63 Exercise 8 Problem 14
Question 14.
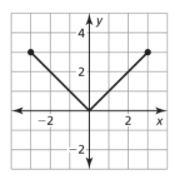
Given the graph below, determine whether the relation it represents is a function. Use the vertical line test to justify your answer.
Answer:
Given: The graph
We have to find that the given graph represents a function or not.
Here, we use the vertical line test to check the given graph is a function or non-function
Applying vertical line test in the given graph
We can see in the above graph that when we draw a vertical line from any point it will not pass through more than one point.
Hence, the given graph represents a function.
When we apply the vertical line test we get that it will not pass through more than one point. Hence, the given graph represents a function

Page 63 Exercise 9 Problem 15
Question 15.
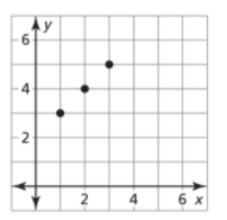
Given the graph below, determine the domain and range of the function represented by the graph.
Answer:
Given: The graph
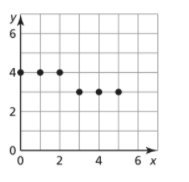
To find – The domain and range of the function represented by the graph.
First, from the graph determine the coordinates points.
x− coordinates represent the domain.
y−coordinates represent the range.
Find the coordinates from the graph
The coordinate points are (0,4),(1,4),(2,4),(3,3),(4,3),(5,3)
Find the domain and range
Since, x− coordinates represent the domain.
Domain: D→{0,1,2,3,4,5}
And, y− coordinates represent the range.
Range: R → {4,3}
Hence, the domain D → {0,1,2,3,4,5} and Range R → {4,3} from the given graph.
Chapter 3 Maintaining Mathematical Proficiency Explained Big Ideas Math Integrated Math 1 Page 63 Exercise 10 Problem 16
Question 16.
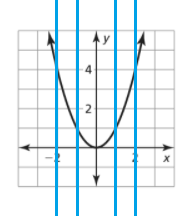
Given the graph below, determine the domain and range of the function represented by the graph.
Answer:
Given: The graph

To find – The domain and range of the function represented by the graph.
First, from the graph determine the coordinates points.
x−coordinates represent the domain.
y−coordinates represent the range.
The given is
From the graph, we can say that it is a continuous graph.
So, since x− coordinates represent the domain.
Domain: D→[−3,3]
And, y−coordinates represent the range.
Range: R→[0,3]
Hence, the domain and range of the given graph are Domain D→[−3,3], and Range R→[0,3]
Page 63 Exercise 11 Problem 17
Question 17.
Given the function, y = 12x, where y represents the number of pages printed and x represents the time taken to print in minutes, identify the independent and dependent variables.
Answer:
Given: y = 12x
To find – Independent and dependent variables from the given function.
Here, y is the number of pages and x is the time taken to print in minutes.
y = 12x [Given function]
Since y is the number of pages and x is the time taken to print in minutes.
Here, the independent variable is ‘x ‘ time taken to print in minutes.
And, the dependent variable is ′y′ the number of pages printed.
The independent variable is ′x′and the dependent variable is ′y′in the given function y = 12x.
Page 63 Exercise 12 Problem 18
Question 18.
Given the function, y = 12x with a domain of {1,2,3,4}, find the range of the function.
Answer:
Given: The function y = 12x
The domain of the given function is 1,2,3 and 4.
We have to find the range of the given function.
By putting different values of x = 1,2,3,4 find the value of y.
Here, x represents domain and y represents the range.
Put the value of x = 1,2,3,4 in the given function y=12x
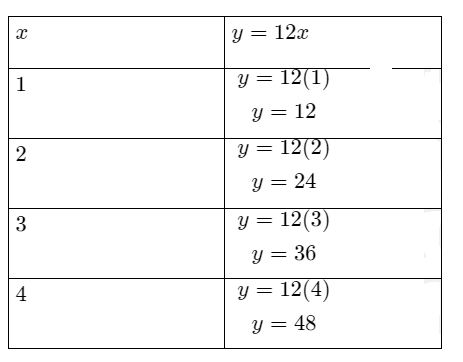
From the above table, we get
Range = 12,24,36,48
Hence, the range of the given function y = 12x whose domain is 1,2,3 and 4is 12,24,36,48 .
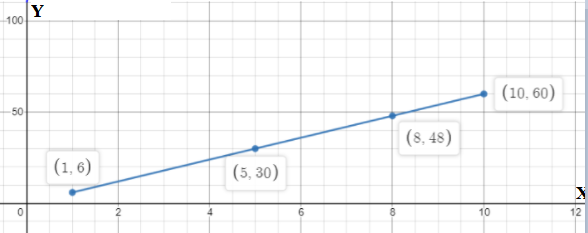
Page 64 Exercise 13 Problem 19
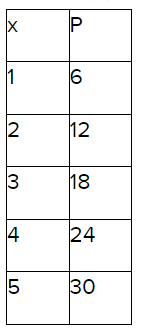
Question 19.
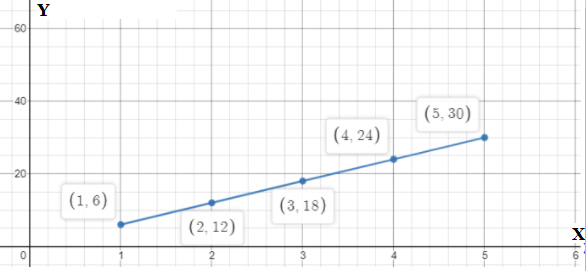
Given the length l = 2x and the breadth b = x of a rectangle, where x = 1, 2, 3, 4, 5:
- Complete the table for the perimeter P of the rectangle using the formula P = 2 (l+b).
- Plot the points on a graph where the x-axis represents x and the y-axis represents P.
- Determine whether the pattern is linear or non-linear.
Answer:
Given:
Length of the rectangle, l=2x
The breadth of the rectangle, b=x
x = 1,2,3,4,5
We have to complete the given table
And, draw the graph and find the pattern whether it is linear or non-linear.
Using the formula of the perimeter of the rectangle complete the given table.
Then put the points on the graph and find the pattern.
Perimeter of rectangle, P = 2(l + b)
Put l = 2x and b = x in the above formula
P = 2(2x + x)
P = 2(3x)
P = 6x
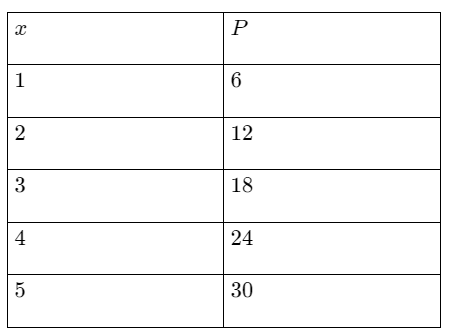
Now, put x = 1,2,3,4,5 in above equation to find the value of P
For x = 1
P=6(1)
⇒ P = 6
For x=2
P = 6(2)
P = 12
For x = 3
P = 6(3)
P = 18
For x = 4
P = 6(4)
P = 24
For x = 5
P = 6(5)
P = 30
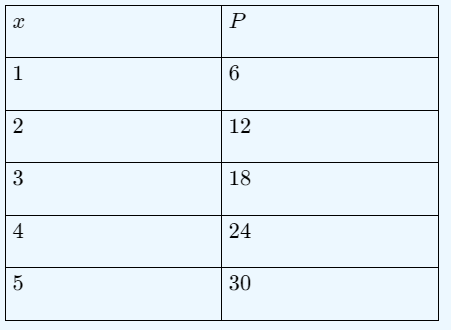
Make the table
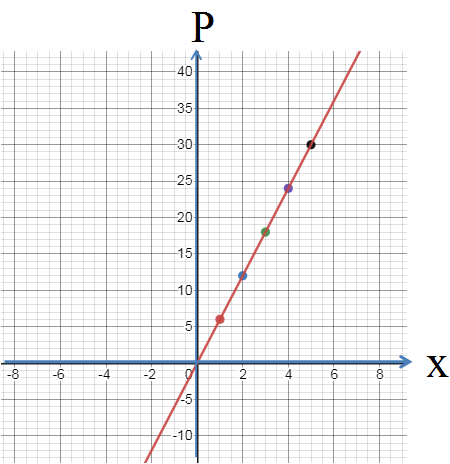
Now, mark the points on the graph x-axis represents x.
And, the y−axis represents P.

Hence, the graph is in a linear pattern.
Hence, the table is
And it makes a linear pattern shown in the below graph.
Worked Examples For Big Ideas Math Integrated Math 1 Chapter 3 Maintaining Mathematical Proficiency Page 64 Exercise 13 Problem 20
Question 20.
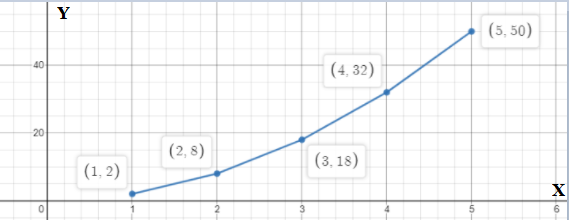
Given the length l = 2x and the breadth b = x of a rectangle, where x = 1,2,3,4,5:
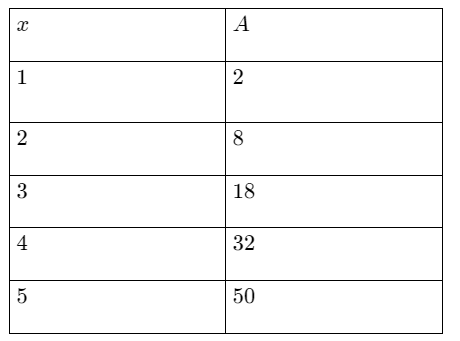
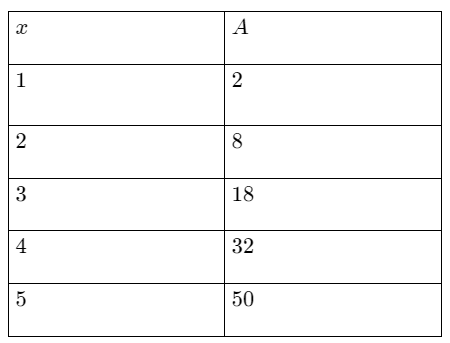
- Complete the table for the area A of the rectangle using the formula A = l x b.
- Plot the points on a graph where the x-axis represents x and the y-axis represents A.
- Determine whether the pattern is linear or non-linear.
Answer:
Given:
Length of the rectangle, l = 2x
The breadth of the rectangle, b = x
x = 1,2,3,4,5
We have to complete the given table
And, draw the graph and find the pattern whether it is linear or non-linear.
Using the formula of the area of the rectangle complete the given table.
Then put the points on the graph and find the pattern.
Area of the rectangle, A = l × b
Put l = 2x and b = x in the above formula
A = 2x × x
A= 2 x2
Now, put x = 1,2,3,4,5 in the above equation
For x = 1
A = 2(1)2
A = 2 × 1×1
A = 2
For x = 2
A = 2(2)2
A = 2 × 2 × 2
A = 8
For x = 3
A = 2(3)2
A = 2 × 3 × 3
A = 18
For x = 4
A = 2(4)2
A = 2 × 4 ×4
A = 32
For x = 5
A=2(5)2
A = 2 × 5 × 5
A = 50
The table is
Now, mark the points on the graph
The x-axis represents the value of x.
And, y-axis represents the value of A.

Since the above graph makes a parabola and a parabola is a non-linear graph.
Hence, the complete table is
The graph is
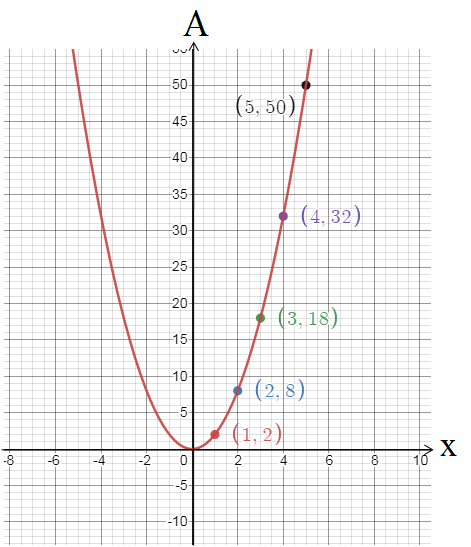
Since the above graph makes a parabola and parabola is a non-linear graph.
Page 64 Exercise 13 Problem 21
Question 21.
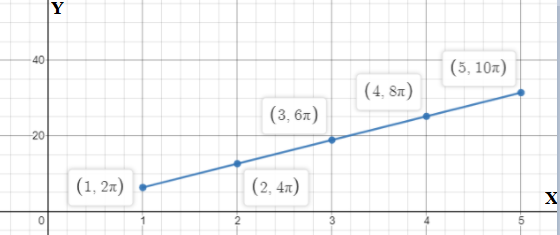
- Given the radius r = 1,2,3,4,5 of a circle, where C is the circumference of the circle:
- Complete the table for the circumference C of the circle using the formula C = 2πr.
- Plot the points on a graph where the x-axis represents r and the y-axis represents C.
- Determine whether the pattern is linear or non-linear.
Answer:
Given:
The radius of circle, r = 1,2,3,4,5C is the circumferences of the circle.
We have to complete the given table
And, draw the graph and find the pattern whether it is linear or non-linear.
Using the formula of the circumferences of the circle to complete the given table.
Then put the points on the graph and find the pattern.
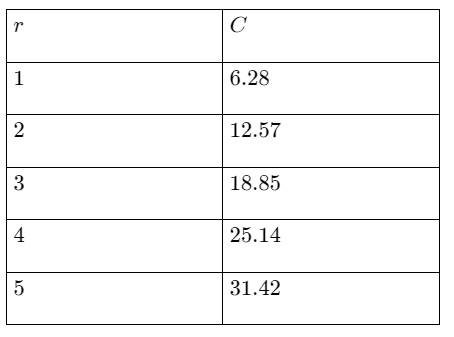
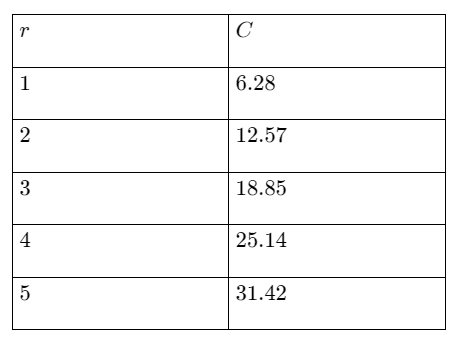
Circumferences of a circle, C = 2πr
Put r = 1,2,3,4,5 in the above formula
For r = 1
C = 2×\(\frac{22}{7}\)×1
C = 6.28
For r = 2
C = 2×\(\frac{22}{7}\)×2
C = 12.57
For r = 3
C = 2×\(\frac{22}{7}\)×3
C = 18.85
For r= 4
C = 2×\(\frac{22}{7}\)×4
C = 25.14
For r = 5
C = 2×\(\frac{22}{7}\)×5
C = 31.42
Make the table
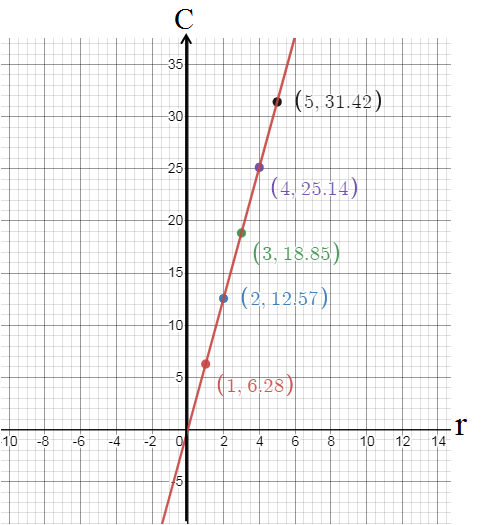
Now, plot the points on the graph
The x-axis represents the radius of the circle, r
The y−axis represents the circumferences of the circle, C

Hence, the graph makes a linear pattern.
Hence, the table is
And, the graph makes a linear pattern which can be shown below.
Big Ideas Math Integrated Math 1 Chapter 3 Detailed Answers Page 64 Exercise 13 Problem 22
Question 22.
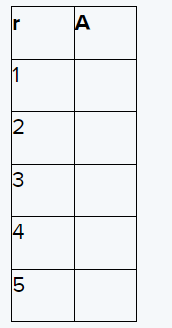
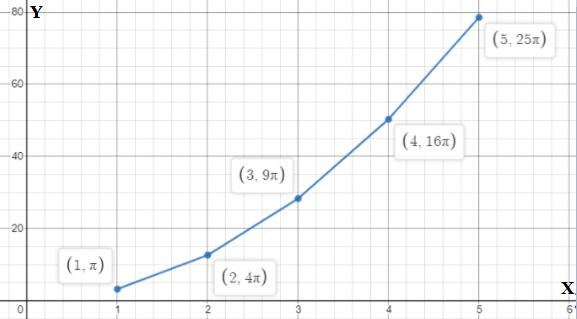
Given the radius r and the area A of a circle, complete the table and determine whether the function is linear or non-linear by drawing the graph.
1. Use the formula A = πr2 to find the area for each given radius r = 1,2,3,4,5.
2. Complete the table:
\(\begin{array}{|l|l|}\hline r & \text { Area } A-\pi r^2 \\
\hline 1 & \\
\hline 2 & \\
\hline 3 & \\
\hline 4 & \\
\hline 5 & \\
\hline
\end{array}\)
3. Plot the points on a graph where the x-axis represents the radius r and the y-axis represents the area A.
4. Determine whether the graph represents a linear or non-linear function.
Answer:
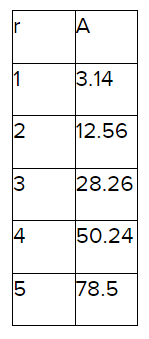
The given table is
Where r is the radius and A is the area of the circle.
Now, find the area with respect to different radius and do draw the graph to check whether the function is linear or not.
We know the formula for area of circle
A = πr2
So, for the given radius, the area can be calculated with the help of above formula i.e.
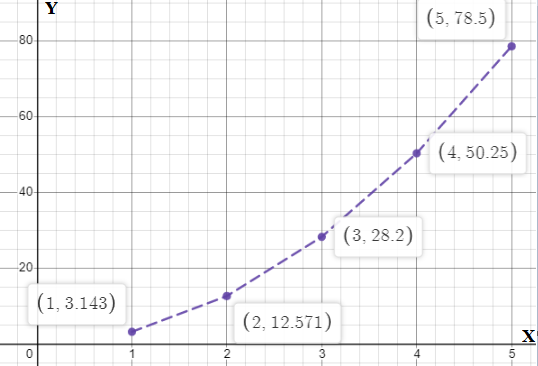
So, the graph is

This shows that the graph of the data is not in a straight line i.e. non-linear which cannot be written in the form of y = mx + b.
Hence, it is concluded that the graph of the given data including radius with respect to area of a circle is not a linear function
Page 65 Exercise 14 Problem 23
Question 23.
Given the graphs from Big Ideas Math Integrated Math 1 Student Journal 1st Edition Chapter 3 Maintaining Mathematical Proficiency Page 64 Exercise 13 Problems (19-22), determine whether each graph represents a function. Use the vertical line test to justify your answer.
- Problem 19: The perimeter of a rectangle for different lengths x and breadth 2x.
- Problem 20: The area of a rectangle for different lengths x and breadth 2x.
- Problem 21: The circumference of a circle for different radii r.
- Problem 22: The area of a circle for different radii r.
Answer:
Here, from the given data, we have to draw the graph of dependent variable with respect to independent variable.
If no vertical line drawn would intersect the curve more than once, then it will be a function.
For Page 64 Exercise 13 Problems (19 – 22) lets plot the graph.
For Page 64 Exercise 13 Problem 19 the perimeter of the rectangle for different length x and breadth 2x.
So, the graph is
Since no vertical line intersects the line more than once. So, the graph does represent a function.
For Page 64 Exercise 13 Problem 20 , the area can be calculated as A = L × B.
Since no vertical line intersect the curve more than once. So, the graph does represent a function.
For Page 64 Exercise 13 Problem 21, circumference(C) can be calculated for radius r is C = 2πr
Since no vertical line intersects the curve more than once. So, the graph does represent a function.
For Page 64 Exercise 13 Problem 22, area(A) of the circle can be calculated as A = πr2
Since, no vertical line can intersect the line more than once.
So, the graph does represent a function.
Hence, for the Page 64 Exercise 13 Problems(19 – 22) there is no vertical line that intersect the line more than once. So, the graph does represent a function
Page 65 Exercise 15 Problem 24
Question 24.
To determine whether a function is linear or not, consider the example of the perimeter of a rectangle with length x and breadth 2x. The perimeter P can be calculated using the formula P = 2(L + B).
- Given the formula for the perimeter, p = 2(L + B), where L = x and B = 2x, rewrite the formula in terms of x.
- Complete the table below for the perimeter when x = 1,2,3,4,5.
- Plot the graph using the values from the table.
- Determine if the function is linear or non-linear based on the graph.
Answer:
To explain whether a function is linear or not, let’s take an example to explain it.
Consider an example of perimeter of a rectangle of length x and breadth 2x such that perimeter can be calculated as P = 2(L + B).
The graph of the data for perimeter of rectangle
The graph Is

Since, the graph of the function is straight line and can be written in the form of y = mx + b and no vertical line drawn is intersecting the curve more than once.
So, it is a linear function.
And if any vertical line drawn would intersect the curve more than once, then it will be a nonlinear function.
Hence, the function is linear or not depends on whether the graph of the data makes a straight line or not and also to check any vertical line drawn would intersect the curve more than once or not
Page 65 Exercise 16 Problem 25
Question 25.
Consider the following real-life problems and determine whether they represent linear or nonlinear functions. Explain your reasoning and sketch the graphs to illustrate each example.
Answer:
To define real life problem of linear and nonlinear functions. We will consider examples to understand it.
The function represents linear :
Example:- A 20-gallon bathtub is draining at a rate of 2.5 gallons per minute.
The number g of gallons remaining is a function of the number m of minutes.
Since the water in the bathtub (y) is decreasing by a constant amount (x).
So, the graph of the function is
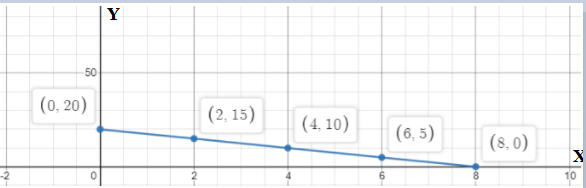
Since the graph is a straight line and so is a linear function.
The function represents Nonlinearly:
Example:- Diamond cutter is making a pendant and that pendant is going to be circular.
A customer decide to buy that pendant and ask how large that pendant will be.
In this situation, the area of the pendant can be calculated with the help of the formula
A = πr2 and so for different radius, we get the graph as
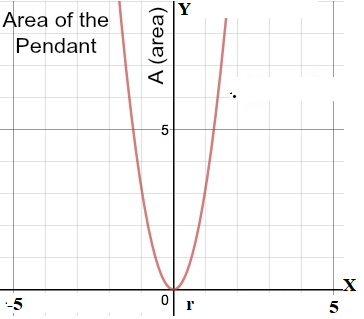
Since the graph is not a straight line and so is a nonlinear function.
Hence, the real-life examples of linear and nonlinear functions are
1. A 20-gallon bathtub is draining at a rate of 2.5 gallons per minute. The number g of gallons remaining is a function of the number m of minutes
2. Diamond cutter is making a pendant and that pendant is going to be circular.
3. A customer decide to buy that pendant and ask how large that pendant will be.
Page 68 Exercise 17 Problem 26
Question 26.
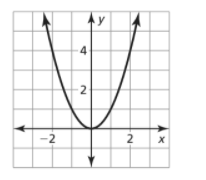
The graph of a given function is shown below.
Graph:
(Include the graph from Big Ideas Math Integrated Math 1 Student Journal 1st Edition Chapter 3 Maintaining Mathematical Proficiency Page 68 Exercise 17 Problem 26 Graph 1)
- Check whether the function is linear or not with the help of the given graph.
- Explain your reasoning based on the characteristics of the graph.
Answer:
The graph of the given function is
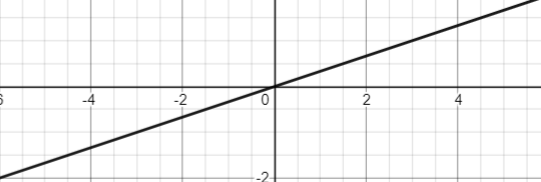
Check whether the function is linear or not with the help of given graph.
Since, from the graph, the rate of change of x with respect to y is constant and so make a straight line.
For a function to be linear, the line of graph must be straight where there is no vertical line that intersect the curve more than once and it can be seen that there exist no vertical line.
That intersect the curve more than once and so the given graph is of linear function.
Hence, the given graph of the function is a graph of linear function
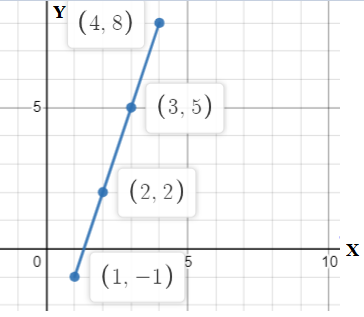
Page 68 Exercise 18 Problem 27
Question 27.
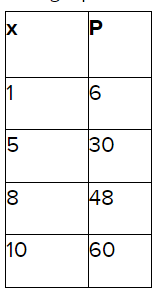
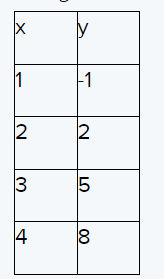
Given the data in the table below.
\(\begin{array}{|l|l|}\hline x & y \\
\hline 1 & 2 \\
\hline 2 & 4 \\
\hline 3 & 6 \\
\hline 4 & 8 \\
\hline 5 & 10 \\
\hline
\end{array}\)
- Check the rate of change of values between x and y.
- Plot the graph of the function using the given data.
- Determine whether the graph represents a linear function.
Answer:
The given data in the form of a table is
Now, check the rate of change of values between x and y.
From the given table, the rate of change between x and y values is constant i.e. the graph of the function is

This implies that the graph of the function is linear.
Hence, the table of the data is a linear function from the graph
Big Ideas Math Integrated Math 1 Student Journal Chapter 3 Maintaining Proficiency Answers Page 68 Exercise 19 Problem 28
Question 28.
Given the data in the table below:
\(\begin{array}{|l|l|}\hline x & y \\
\hline 1 & 3 \\
\hline 2 & 6 \\
\hline 3 & 12 \\
\hline 4 & 20 \\
\hline 5 & 30 \\
\hline
\end{array}\)
- Check the rate of change of values between x and y.
- Plot the graph of the function using the given data.
- Determine whether the graph represents a linear function.
Answer:
The given data in the form of table is
Now, check the rate of change of values between x and y.
From the given table, the rate of change between x and y values is not constant i.e. the graph of the function is

This implies that the graph of the function is nonlinear.
Hence, the table of the data is a nonlinear function from the graph
Page 68 Exercise 20 Problem 29
Question 29.
Given equation y = 3-2x:
- Check whether the equation can be written in the form y = mx + b, where m is the slope and b is the y-intercept.
- Determine the slope m and the y-intercept b.
- Confirm whether the equation represents a linear function.
- Plot the graph of the equation and verify its linearity.
Answer:
The given equation is
y = 3−2x
Now, check the equation can be written in the form of y = mx + b, where m is the slope.
Since the equation can be written as
y = −2x + 3
Where m is -2 and b is 3. Therefore, the given equation is linear function.
Also, from the graph
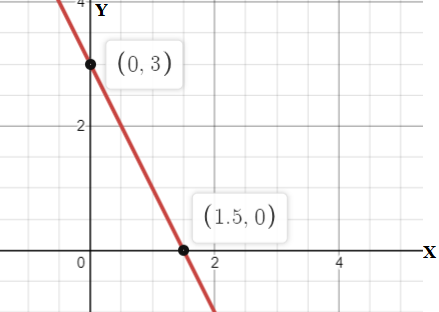
This implies that the graph of the function is linear.
Hence, the equation y = 3−2x is a linear function.
Page 68 Exercise 21 Problem 30
Question 30.
Given the equation \(y=-\frac{3}{4} x^3\):
- Check whether the equation can be written in the form y = mx + b, where m is the slope and b is the y-intercept.
- Determine if the equation represents a linear or nonlinear function.
- Explain why the equation is considered nonlinear.
- Plot the graph of the equation and verify its nonlinearity.
Answer:
The given equation is
y = \(\frac{-3}{4}\) x3
Now, check the equation can be written in the form of y = mx + b, where m is the slope.
Since the given equation can not be written in the form of y = mx + b.
Therefore, the given equation is nonlinear.
Also, from the graph
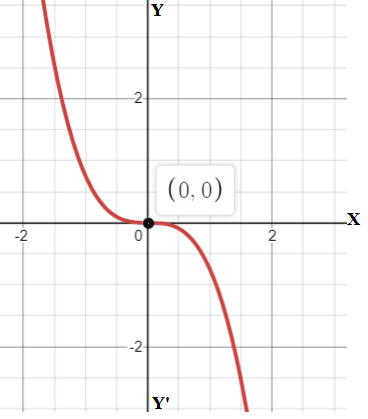
This implies that the equation is nonlinear function.
Hence, the given equation is a nonlinear equation.
Page 68 Exercise 22 Problem 31
Question 31.
Given the graph of the function:
(Big Ideas Math Integrated Math 1 Student Journal 1st Edition Chapter 3 Maintaining Mathematical Proficiency Page 68 Exercise 22 Problem 31 Graph)
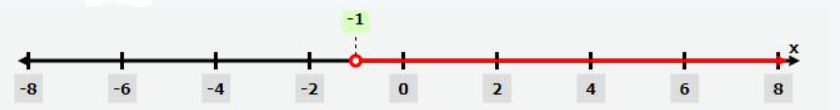
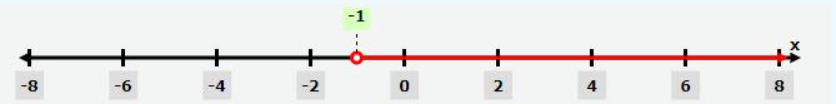
- Observe the given graph and determine whether it has a continuous domain or a discrete domain.
- Explain the reasoning behind your conclusion.
- State the domain of the given graph.
Answer:
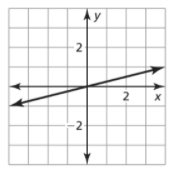
The graph of the given function is
Now, observe the graph and find whether it has a continuous domain or a discrete domain.
Hence, the domain of the given graph is the continuous domain.
Page 68 Exercise 23 Problem 32
Question 32.
Given the graph of the function:
(Big Ideas Math Integrated Math 1 Student Journal 1st Edition Chapter 3 Maintaining Mathematical Proficiency Page 68 Exercise 23 Problem 32 Graph)
- Observe the given graph and determine whether it has a continuous domain or a discrete domain.
- Identify the domain of the function from the graph.
- Explain why the domain is classified as continuous or discrete.
Answer:
The graph of the given function is
Now, observe the graph and find whether it has a continuous domain or a discrete domain.
Since the domain is a set of input values for which function exist and input values are the x-values.
Therefore, from the graph, the domain(D) is D = {1,2,3}
Also, the domain of the function is a discrete domain as only integer values are being used in the graph.
Hence, the domain of the given graph is the discrete domain.