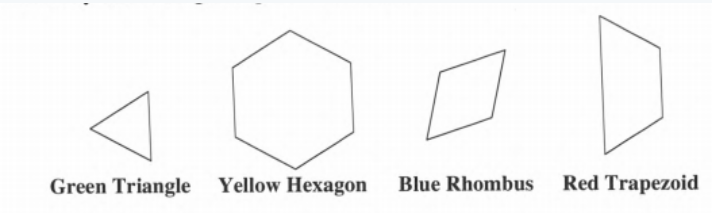
Core Connections Course 1 Student 1st Edition Chapter 2 Arithmetic Strategies and Area
Core Connections Course 1 Student 1st Edition Chapter 2 Exercise 2.3 Solutions Page 77 Problem 1 Answer
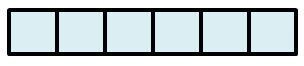
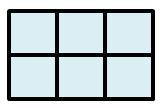
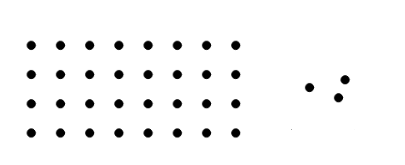
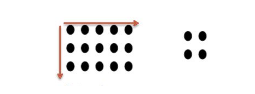
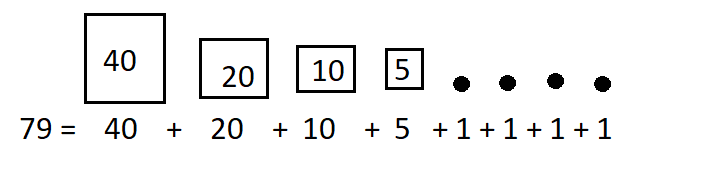
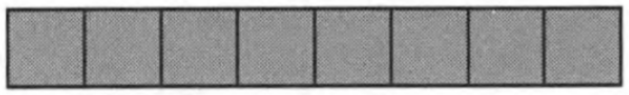
Given : There are (1×100)+(5×10)+(6×1)=156 blocks.
We need to come up with examples of various rectangles that can be constructed from the above blocks.
Each block can be thought of as a one square unit as the rectangles made by this set will have exactly 156 square units of area and we have 1 hundreds block, 5 tens blocks and 6 ones blocks.
To construct the rectangle using these blocks we have to take care that its opposite side must have the same lengths.
We should start with one hundred blocks and try to cover it in as many ways as we can.
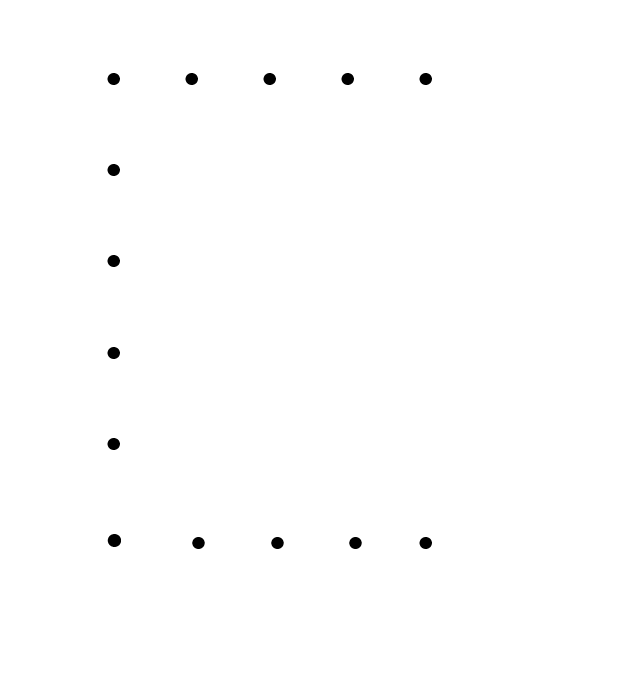
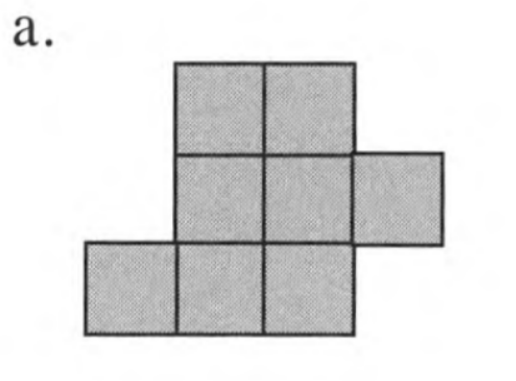
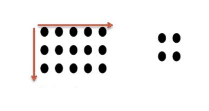
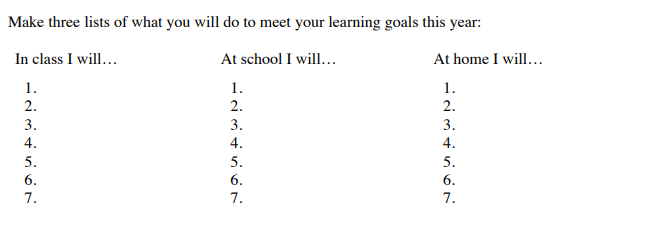
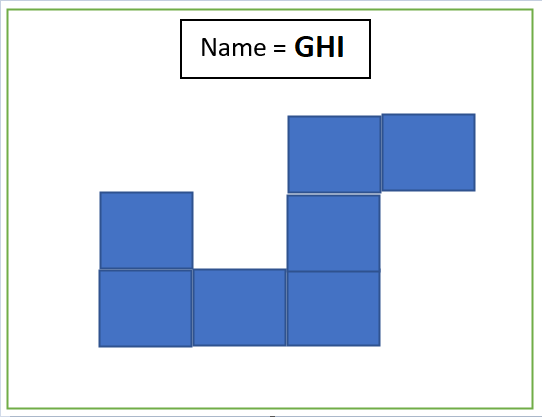
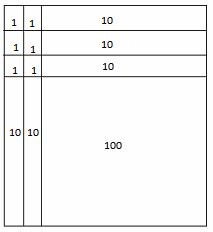
For example, we have taken a hundred blocks and placed 2 ten blocks on either of its sides and then place the remaining two ten blocks above it, then to make the length of opposite sides equal we must put all the 6 one blocks above the two ten blocks piled in the pairs of 2.
Read and learn More Core Connections Course 1 Student 1st Edition Solutions
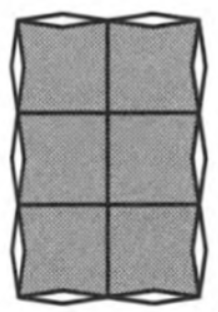
The first rectangle that can be constructed is:
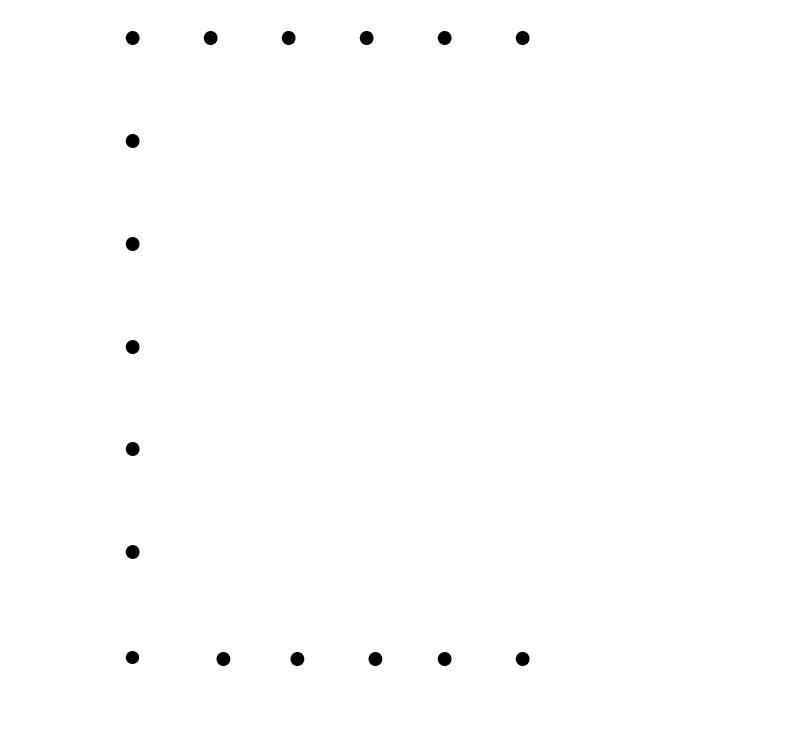
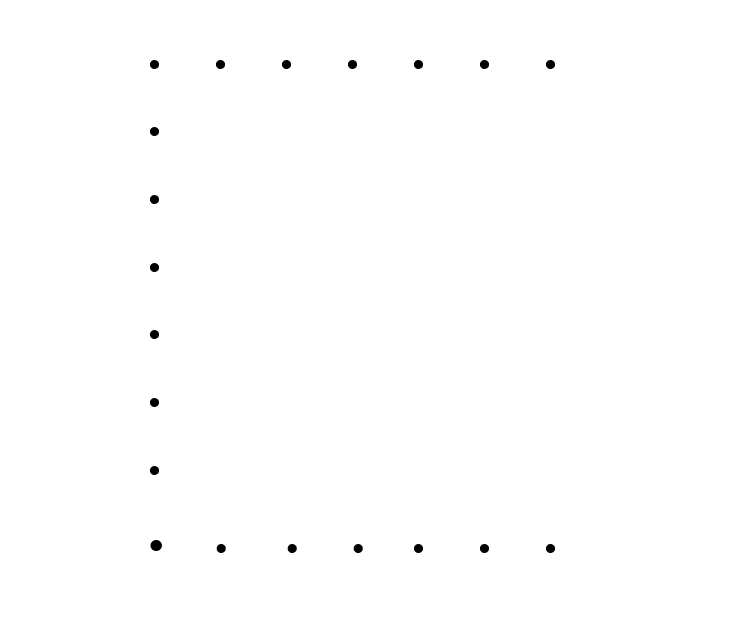
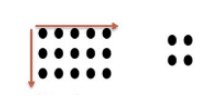
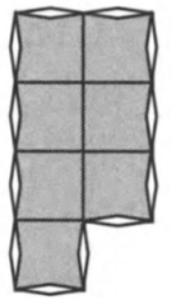
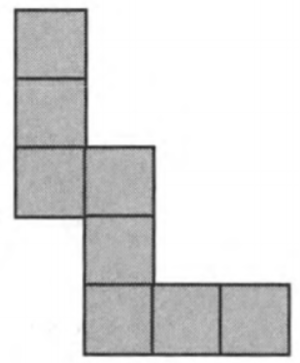
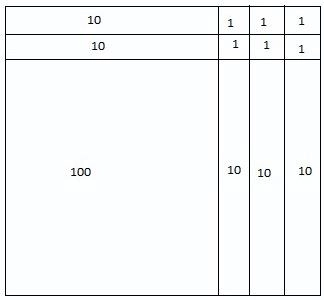
The second rectangle can be constructed as:
They can be represented as this also
graphics 3 for exercise 2-53 page 77 pre-algebra part (a)
The obtained rectangles by arranging the blocks are
Yes, there are more than one ways to make a rectangle from the given blocks.
Core Connections Course 1 Student 1st Edition Chapter 2 Exercise 2.3 Solutions Page 77 Problem 2 Answer
We already have gotten two rectangles from the previous question 2-53(a) as:
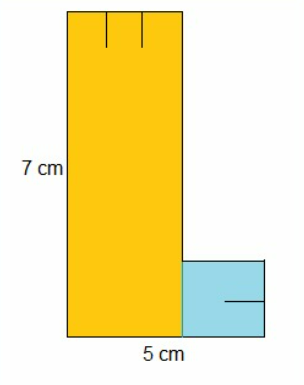
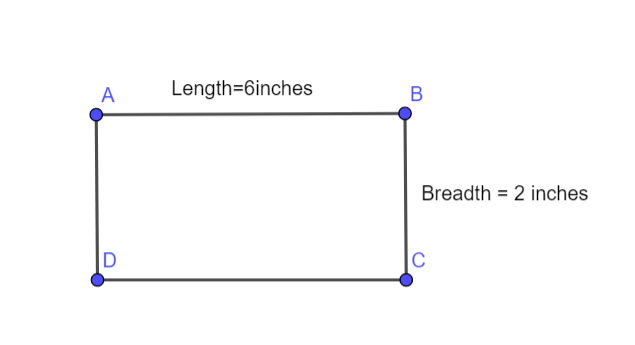
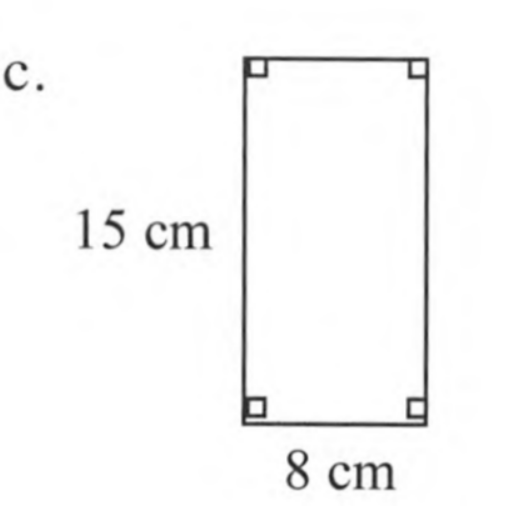
We have to measure the length and width of the larger rectangle formed in both the cases.
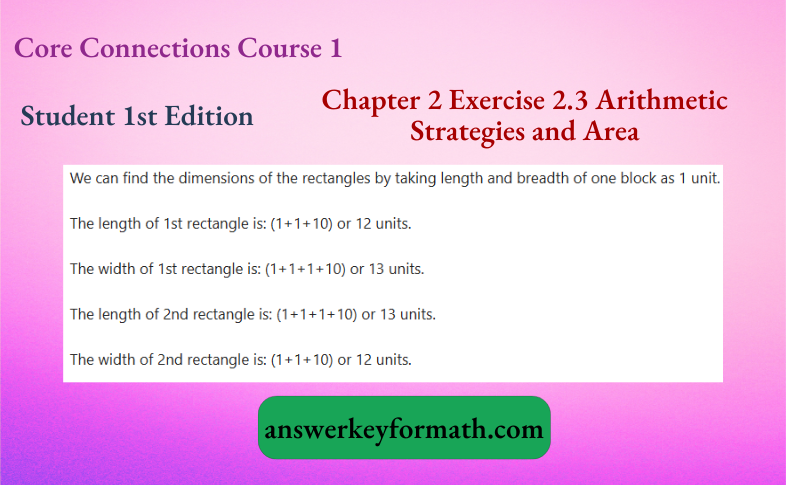
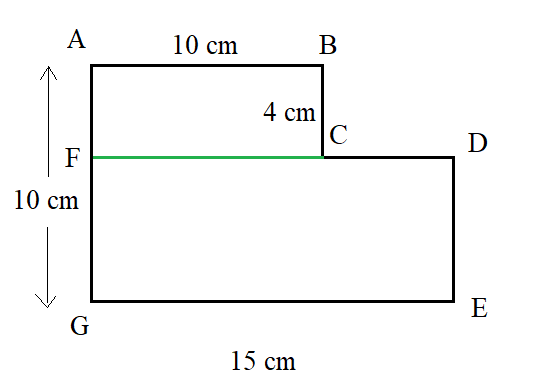
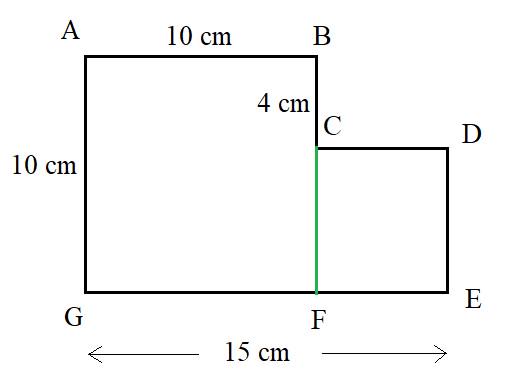
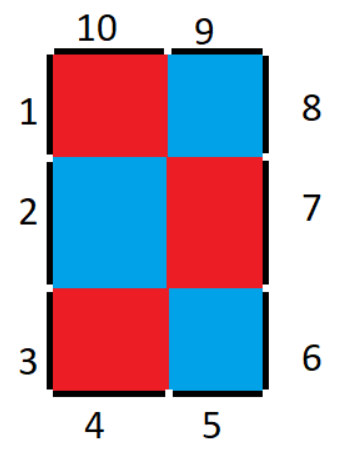
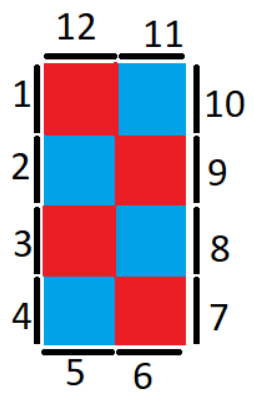
The calculated dimensions of both the rectangles are shown in the below figure:
The sketch of the rectangles are
The dimensions are both the rectangles are different. 1st rectangle is taller than the second rectangle while the second one is wider, But the perimeter and areas of both the rectangles are same.
Chapter 2 Exercise 2.3 Arithmetic Strategies And Area Solutions Core Connections Course 1 Page 77 Problem 3 Answer
Given: We have got two rectangles from our answered previous question(2-53-Part(a))
We have to check whether the given labels of dimensions make sense or not.
Each block can be thought of as a one square unit as the rectangles made by this set will have exactly 156 square units of area and we have 1 hundreds block, 5 tens blocks and 6 ones blocks.
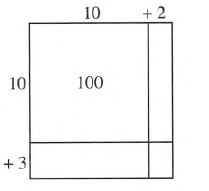
The dimensions 10+3 and 10+2 make sense as:
It equals 12 and 13 which are the dimensions of our obtained rectangles.10 plus 2 or 10 plus three mean there are 10 units (1 block) and 2 units (2 blocks of 1 unit each) in the first case and 3 units (3 blocks of 1 unit each).
These represent how the rectangles were constructed.Our explanation is shown in the figure as following :
10+2 and 10+3 make good enough labels for rectangles as they represent the dimensions as well the construction of the rectangles obtained by the arrangement of the blocks as
Core Connections Course 1 Chapter 2 Page 77 Problem 4 Answer
We have the two rectangles with us from question 2-53(@) as:
We have to analysis both the rectangles and answer that which arrangement is the easiest to see.
We have anaylse them and have to answer them by symmetric visualization and balance.
Since both the rectangles are the same as the second one can be obtained by rotating the first rectangle by 90 degrees in either direction.
We can calculate the length and width by counting the number of square unit blocks in the entire length and width of the rectangles formed.
The area can be calculated by counting the number of square unit blocks in the total figure as shown in the figure.
Since both the rectangles are roughly the same, either of the rectangle can be used to calculate the area and perimeter.
The figure I’d choose which is easiest to calculate the dimensions and perimeter is
Area of the given rectangle is Area=13×12
=156 sq. units.
According to the visual symmetry and balance the most easiest rectangle to measure its dimensions and area is
Chapter 2 Exercise 2.3 Arithmetic Strategies And Area Solutions Core Connections Course 1 Page 77 Problem 5 Answer
We have given two rectangles obtained by arranging the blocks as :
We have to find the relation between the total value of each block and the dimensions of the rectangle and have to calculate its total area in at least two ways.
We can find the area by the formula Area of the rectangle=Length×Breadth and as we know that the area of each one block is 1 sq.units.
We can find the area of Alan’s rectangle in the following two ways:
Way 1:You can use the formula to calculate area of the rectangle; area=length×width.
Solving it, area=(12×13)
=156 sq.units.
Way 2; You can calculate the number of blocks of 1 unit square that are required to fill the space completely without gaps or overlaps.
(1×100)+(5×10)+(6×1)=156 sq.units.
So they are related as the dimension is (number of blocks placed along the dimension of the rectangle) times the dimension of each one block.
Using both the methods, we come to see that the area of the rectangle comes out to be 156 square units.
Core Connections Course 1 Chapter 2 Page 77 Problem 6 Answer
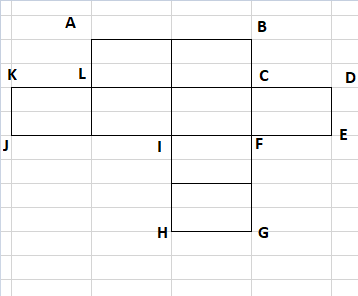
Given that Alan is trying to multiply 12⋅13 and get an exact answer without having to build the product with Base Ten Blocks:

It is asked to examine Alan’s diagram and discuss with your team how it relates to the shape he built with blocks and why did he label the sides “10+3” and “10+2”.
Alan wanted to find the product of 13 and 12 but instead of using Base-10 Blocks Alan drew a figure and labelled its sides as 10,3,10,2, this is because Alan has divided number 13 and number 12 into two parts 10+2 and 10+3 so that the diagram may resemble the Base-10 Block arrangement he made earlier, this will simplify the problem as he already knows the area of Base-10 blocks, so he is dividing his figure such that he can make use of that information to find out the product.
Thus, Alan drew a figure and labelled its sides as 10,3,10,2, this is because Alan has divided number 13 and number 12 into two parts “10+2” and “10+3” so that the diagram may resemble the Base-10 Block arrangement he made earlier.
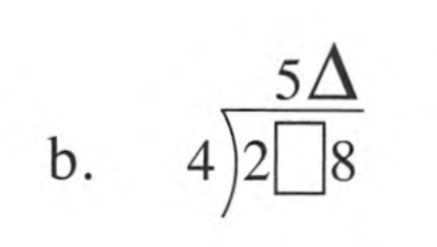
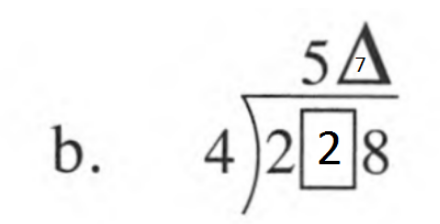
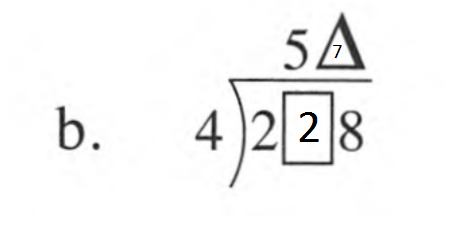
Core Connections Course 1 Chapter 2 Exercise 2.3 Step-By-Step Solutions Page 77 Problem 7 Answer
Given that Alan is trying to multiply 12⋅13 and get an exact answer without having to build the product with Base Ten Blocks:
It is asked to show how Alan got “100” and what does the “100” represent, then fill in the other three smaller rectangles the same way.
Now by using generic rectangle definition we will solve given problem.
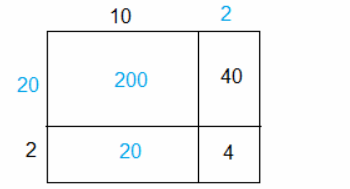
For the problem 13⋅12, think of 13 as 10+3 and 12 as 10+2. Use these numbers as the dimensions of a large rectangle, as shown below.
Now we will determine the area of each of the smaller rectangles and then find the sum of the four smaller areas. So, the area of each block are:
10×10=100.
10×2=20.
10×3=30.
3×2=6.
The number 100 represents the area of that portion of figure because in the given generic rectangle the length of the square present in the upper left corner is 10, it is similar to the Base-10 Block arrangement in which the area of block is known.
The remaining figure can be completed as below;
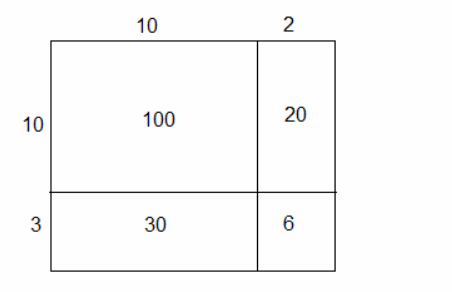
Thus, the number 100 represents the area of an upper-left portion of the figure(with dimensions:10×10), and the completed figure is shown below:
Core Connections Course 1 Chapter 2 Page 77 Problem 8 Answer
Given that Alan is trying to multiply 12⋅13 and make a diagram:
We have to find the total area represented by the entire rectangle, using 2 different methods.
The area of the figure can be found out using two following methods:
Method 1: To Add up the area of individual blocks.
Method 2: To find the area using mathematical formula
Area =length×width.
Method 1: Add up the area of individual blocks.
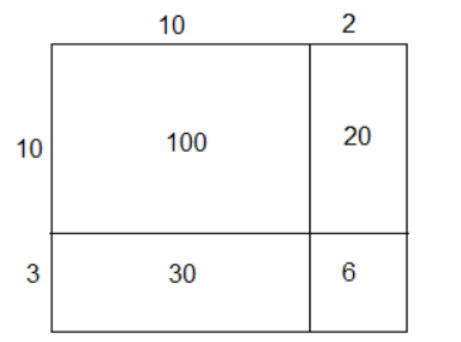
From the given generic rectangle figure, it has 4 blocks and each has length and width. So, each block area is:
Area of first block:10×10=100
Area of second block:10×3=30
Area of third block:10×2=20
Area of fourth block: 3×2=6
Total area= sum of area of each block
=100+30+20+6
=156.
Method 2: Find the area using a mathematical formula i.e.
Area of a rectangle = length ×width.
In the given figure, length is 13 and width is 12 then area will be
Area=13⋅12
=156.
Thus, the area of the figure can be found by following two methods:
- Add up the area of individual blocks
- Find the area using a mathematical formula, Area=length×width.
Core Connections Course 1 Chapter 2 Exercise 2.3 Step-By-Step Solutions Page 77 Problem 9 Answer
Given that Alan is trying to multiply 12⋅13 and get an exact answer without having to build the product with Base Ten Blocks:
It is asked Alan would like to use the generic-rectangle strategy to do more complex multiplication problems.
Work with your team to help Alan draw a generic rectangle to multiply 59⋅46 and find the product.
Now we will draw the generic rectangle for 59×46 and calculate the area to solve given problem.
The generic rectangle will be:
To find the product we need to add up the individual area marked in the figure, 59⋅46
=2000+300+360+54
=2300+414
=2714.
Thus, the product is 59⋅46=2714.
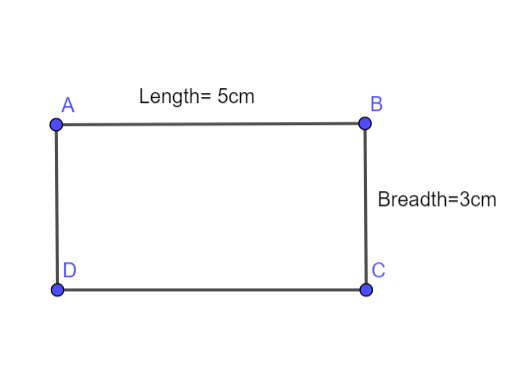
Core Connections Course 1 Chapter 2 Page 78 Problem 10 Answer
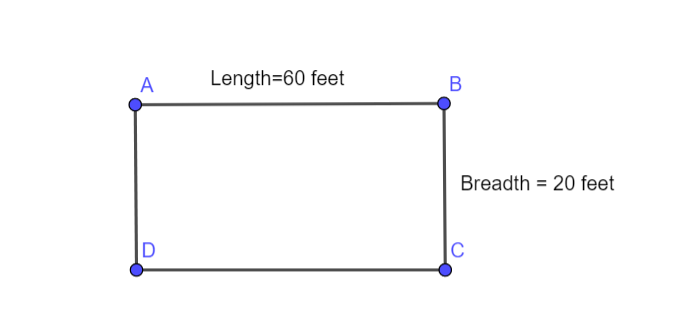
Given that Riley is looking at the diagram at right in his maths book:
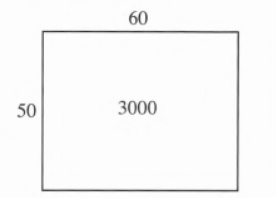
It is asked to identify the factors and product represented by the rectangle.
The given diagram shows the two sides of the rectangle 50 (width) and 60 (length) representing the two numbers (factors) to be multiplied and the value written in the middle 3000 represents the area of the rectangle which is equal to the product of those numbers.
Thus, in the given diagram 50 and 60 are the factors with 3000 as the product.
Solutions For Core Connections Course 1 Chapter 2 Exercise 2.3 Arithmetic Strategies And Area Page 78 Problem 11 Answer
Given fraction is: 1/2.
It is asked to find the two fractions that are equivalent to the given fraction.
Two equivalent fraction of 1/2 are 2/4,4/8.
Thus, two equivalent fraction of 1/2 are 2/4,4/8.
Core Connections Course 1 Chapter 2 Page 78 Problem 12 Answer
Given fraction is: 3/5.
It is asked to find the two fractions that are equivalent to the given fraction.
Two equivalent fraction of 3/5 are: 3×3/5×3=9/15,3×4/5×4=12/20.
Thus, two equivalent fraction of 3/5 are 9/15,12/20.
Solutions For Core Connections Course 1 Chapter 2 Exercise 2.3 Arithmetic Strategies And Area Page 78 Problem 13 Answer
Given fraction is: 4/7.
It is asked to find the two fractions that are equivalent to the given fraction.
Two equivalent fraction of 4/7 are 8/14,12/21.
Thus, two equivalent fraction of 4/7 are 8/14,12/21.
Core Connections Course 1 Chapter 2 Page 78 Problem 14 Answer
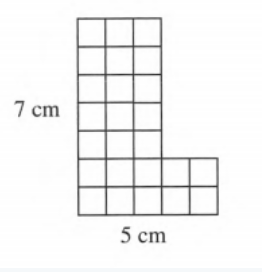
Given: Ethan planted seeds for vegetables in 50% of the garden and flowers and herbs in other parts of the garden.
It is asked if the lightly shaded portion represents flowers, find what percentage of the garden could be herbs.
The entire circle is divided into three portions: vegetables, herbs and flowers.
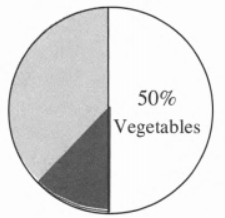
Since 50% is allocated for vegetables, it means that the other 50% is allocated for herbs and flowers.
If we draw a line in the middle of the portion having flowers and herbs, we can see that the herb portion is less than 1/4 of the total portion.
So, the herb garden covers approximately less than 25% of the total portion.
Thus, the herb garden covers approximately less than 25% of the total portion.
Core Connections Course 1 Student 1st Edition Chapter 2 Exercise 2.3 Guide Page 78 Problem 15 Answer
Given: 34.62+74.8.
It is asked to add given expression.
Now we will use the definition of addition to solve given problem.
We will separate given decimal digits and then add like decimal digits separately.
⇒34.62+74.8
⇒34+74+0.62+0.80
⇒108+1.42
⇒109.42.
Thus, the solution is; 34.62+74.8=109.42.
Core Connections Course 1 Chapter 2 Page 78 Problem 16 Answer
Given: 213.09−37.2.
It is asked to subtract given expression.
Now we will use the definition of subtraction to solve given problem.
First, we will separate like decimal digit and number then subtract it.
⇒213.09−37.2
⇒213+0.09−37−0.20
⇒213−37+0.09−0.20
⇒176.00−0.11
⇒175.89.
Thus, the solution is: 213.09−37.2=175.89.
Core Connections Course 1 Student 1st Edition Chapter 2 Exercise 2.3 Guide Page 78 Problem 17 Answer
Given: 3.15+36.8+7.
It is asked to add given expression.
Now we will use the definition of addition to solve given problem.
So, 3.15+36.8+7=46.95.
Thus, the solution is: 3.15+36.8+7=46.95.
Core Connections Course 1 Chapter 2 Page 80 Problem 18 Answer
Given: 25⋅18.
It is asked to draw generic rectangles to help you multiply the given numbers without a calculator and also show the place value of each part of the rectangle, the area of each part, and the area of the whole rectangle.
Now we will make a generic rectangle diagram and by using it we solve given problem.
For the problem 25⋅18, think of 25 as 20+5 and 18 as 10+8.
We will use these numbers as the dimensions of a large rectangle, as shown in the figure below.
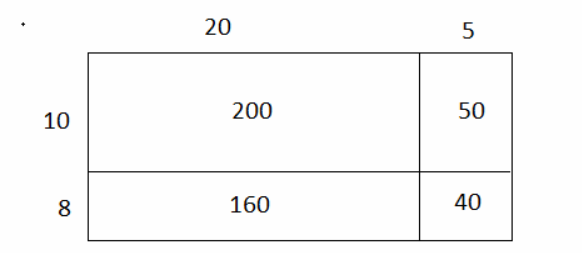
A generic rectangle diagram of 25⋅18 is:
Now we will determine the area of each of the smaller rectangles to find the sum of the four smaller areas, which gives the total area of the generic rectangle.
Area=10⋅20+20⋅8+10⋅5+8⋅5
=200+160+50+40
=360+90
=450.
Thus, the equation for a generic rectangle that shows the total area is: (25⋅18)=200+160+50+40=450 thus 25⋅18=450.
Chapter 2 Exercise 2.3 Arithmetic Strategies And Area Explained Core Connections Course 1 Page 80 Problem 19 Answer
Given: 153⋅25.
It is asked to draw generic rectangles to help you multiply the following numbers without a calculator.
Show the place value of each part of the rectangle, the area of each part, and the area of the whole rectangle.
Now we will make a generic rectangle diagram and by using it we solve given problem.
A generic rectangle diagram of 153⋅25 is:
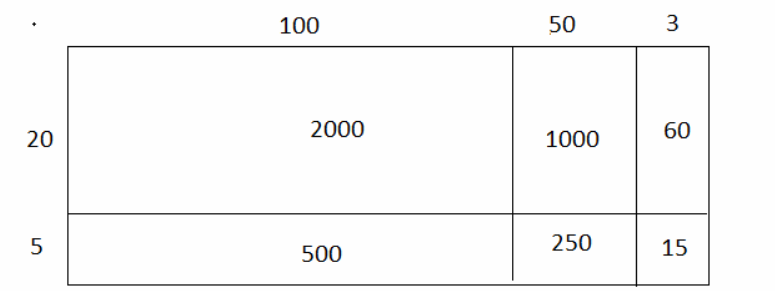
Area=2000+1000+60+500+250+15
=3500+325
=3825.
Thus, the solution is: 153⋅25=3825.
Core Connections Course 1 Chapter 2 Page 80 Problem 20 Answer
Given: 472⋅57.
It is asked to draw generic rectangles to help you multiply the following numbers without a calculator.
Show the place value of each part of the rectangle, the area of each part, and the area of the whole rectangle.
Now we will make a generic rectangle diagram and by using it we solve given problem.
A generic rectangle diagram of 472⋅57 is:
Area=20000+2800+3500+490+100+14
=20000+6300+604
=20000+6904
=26904.
Thus, the solution is: 472⋅57=26904.
Chapter 2 Exercise 2.3 Arithmetic Strategies And Area Explained Core Connections Course 1 Page 80 Problem 21 Answer
Given: 289⋅77.
It is asked to draw generic rectangles to help you multiply the given numbers without a calculator and also show the place value of each part of the rectangle, the area of each part, and the area of the whole rectangle.
Now we will make a generic rectangle diagram and by using it we solve given problem.
For the problem289⋅77, think of 289 as 200+80+9 and 77 as 70+7.
We will use these numbers as the dimensions of a large rectangle, as shown in the figure.
A generic rectangle diagram of 289⋅77 is:
Now we will determine the area of each of the smaller rectangles to find the sum of the four smaller areas, which gives the total area of generic rectangle.
Area=200⋅70+200⋅7+70⋅80+7⋅80+70⋅9+7⋅9
=14000+5600+1400+560+630+63
=14000+7000+1190+63
=14000+7000+1253
=14000+8253
=22253.
Thus, the equation for generic rectangle that shows the total area is: (289)(77)=14000+5600+1400+560+630+63=22253.
Core Connections Course 1 Chapter 2 Page 80 Problem 22 Answer
Given that the three generic rectangles below have been partially labelled with dimensions and area s:
It is asked work with your team to fill in the missing values in each rectangle, then, for each whole rectangle, write the product as a numerical sentence in the form (total length)(total width).
Now we will use the definition of multiplication by using generic rectangle and solve given problem.
(1) Given generic rectangle has four blocks, each block area will be: 2×2=4
In this block area is 4 and side length 2 is given, so the other side will be 2.
20×2=40
In this block the area 40 and side length 2 is given, so the other side will be 20.
20×10=200
In this block side are calculated by previous block’s area, which are 20 and 10.
10×2=20
In this block one side is 2 given and other side is calculated by given area block.
So, the complete figure will be:
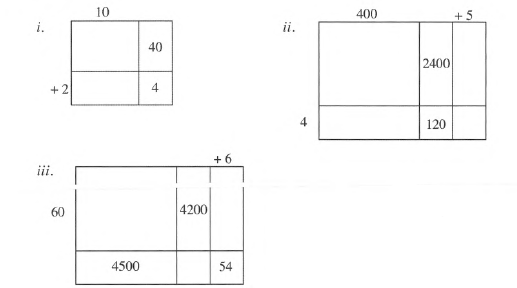
From the above figure, we can say that the generic rectangle one length is 22 and other is 12.
So, the product will be:
22⋅12=(20+2)⋅(10+2)
(20+2)⋅(10+2)=20⋅10+20⋅2+2⋅10+2⋅2
=200+40+20+4
=264
Thus the total area is 264.
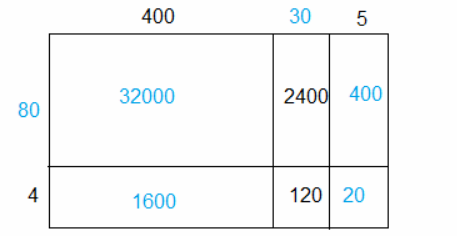
(2). Given generic rectangle has six blocks, each block area will be: 30×4=120
In this block area is 120 and side length 4 is given, so the other side of this block will be 30.
80×30=2400
In this block, area is 2400 and side is 30 ( from previous block area) is given, so the other side will be 80.
400×80=32000
In this block, one side is 400 given and other side is calculated in previous block.
80×5=400
In this block, one side is 5 given and other side is calculated in previous block.
400×4=1600
In this block, one side is 4 given and other side is calculated in previous block.
4×5=20
In this block both side length 4 and 5 is given.
So, the complete figure will be:
From the above figure, we can say that the generic rectangle one length is 435 and other is 84.
So, the product will be:
435⋅84=(400+30+5)⋅(80+4)
=400⋅80+400⋅4+30⋅80+30⋅4+5⋅80+5⋅4
=32000+1600+2400+120+400+20
=36540.
Thus the total area=36540.
(3). Given generic rectangle has six blocks, each block area will be: 9×6=54
In this block, one side is 6 and area is 54 given, so other side will be 9.
9×500=4500
In this block, the area is 4500 given and one side is 9 (from previous block) then the other side will be 500.
500×60=30000
In this block, one side is 60 given and other side is calculated in previous block.
60×70=4200
In this block, area is 4200 and one side 60 is given, and other side will be 70.
60×6=360
In this block, both sides 60 and 6 are given.
9×70=630
In this block, both sides are 9 and 70 are calculated in previous block.
So, the complete figure will be:
From the above figure, we can say that the generic rectangle one length is 576 and other is 69.
So, the product will be:
576⋅69=(500+70+6)⋅(60+9)
=500⋅60+500⋅9+70⋅60+70⋅9+6⋅60+6⋅9
=30000+4500+4200+630+360+54
=39744
Thus the total area is 39744.
Thus, the numerical product sentence for each generic rectangle is:
22⋅12=200+40+20+4=264
435⋅84=32000+1600+2400+120+400+20=36540
576⋅69=30000+4500+4200+630+360+54=39744
Core Connections Course 1 Chapter 2 Page 80 Problem 23 Answer
Given that the three generic rectangles below have been partially labelled with dimensions and areas:
It is asked whether you can find more than one possibility for any of these rectangles or not.
No, there is no other possibilities for the rectangles other than these because by definition generic rectangle is a type of diagram used to visualize multiplying expressions without algebra tiles, and each expression is multiplied to forms a side length of the rectangle, and the product is the sum of the areas of the sections of the rectangle i.e. given area is satisfied for only one factor of multiplication and no other multiplication is possible.
Thus, there is no other possibilities for the rectangles other than these.
Worked Examples For Core Connections Course 1 Chapter 2 Exercise 2.3 Arithmetic Strategies And Area Page 80 Problem 24 Answer
Given: The three generic rectangles below are partially labelled with dimensions and areas:
It is asked to discuss how to find the missing factor when we have the product and one of the factors.
We know that the area written inside the box is equal to the product of number corresponding to that row and column.
The other number can be found out by dividing the value in the box with the given number.
For example we take first given generic rectangle:
It has four blocks. Block 2 and 4 area is given which is 40 and 4 respectively.
4=2×2
for block 4 area only this is possibility because one of side of this block is 2 given.
40=20×2
for block 2 area only this is possibility because one of it side is 2 which is coming from block 2 area.
Now we all have all sides of the given rectangle, which is 10+2=12 and 20+2=22.
So, the complete product will be: 22⋅12.
In this way, we can find other figures complete product.
Thus, in the given generic rectangles figure, the other number can be found out by dividing the value in the box with the number available.
Core Connections Course 1 Chapter 2 Page 81 Problem 25 Answer
Given: 22⋅35.
It is asked to to use a generic rectangle to find the product of 22⋅35, then explain to Martin why his method will not give exact products and what should Martin have done to find the correct product.
Using generic rectangle method we will find the product.
The product can be found out by drawing the rectangle as below:
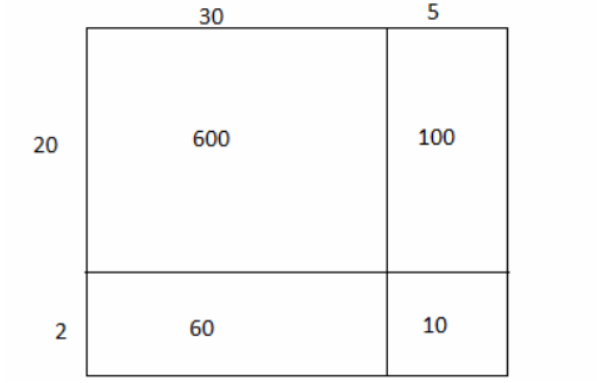
Now, adding up the area of the individual rectangles:
Area =600+100+60+10
=770 sq. units.
Martin multiplied the tens together (20⋅30=600) and the ones together (2⋅5=10), and added the results
600+10=610.
This will not give the exact answer, as we can see from the figure that Martin did not considered two other side rectangles which will come by multiplying tens and ones together.
To find the correct product martin could have multiplied tens and ones along with the other products of tens and ones giving him:
20⋅30=600
2⋅5 =10
20⋅5 =100
2⋅30 =60
And after adding the results he would have got 600+10+100+60=770.
which is the required answer.
Thus, Martin’s method did not give him exact product because he did not consider two other side rectangles which will come by multiplying tens and ones together.
To find the correct product Martin should have multiplied tens and ones along with the other products of tens and ones.