Probability and Statistics for Engineering and the Sciences 8th Edition Chapter 2 Probability
Page 62 Problem 1 Answer
Given: A mutual fund company offers its customers a variety of funds: a money-market fund, three different bond funds, two stock funds and a balanced fund.
Among customers who own shares in just one fund, the percentages of customers in the different funds are as follows:
Money-market 20%
High-risk stock 18%
Short bond 15%
Moderate-risk stock 25%
Intermediate bond 10%
Balanced 7%
Long bond 5%
A customer who owns shares in just one fund is randomly selected.
To find the probability that the selected individual owns shares in the balanced fund.
We will make use of the percentages of customers in different funds given to us.
Let A be the event:
A=” Selected individual owns shares in the balanced fund”
Hence we have:
P(A)= The sum of all given percentage is =20%+18%+15%+25%+10%+7%+5%=100%
The probability of balanced fund is already given that is =7%=0.07
The probability that the selected individual owns shares in the balanced fund is 0.07.
Page 62 Problem 2 Answer
Given: A mutual fund company offers its customers a variety of funds: a money-market fund, three different bond funds two stock funds and a balanced fund.
Among customers who own shares in just one fund, the percentages of customers in the different funds are as follows:
Money-market 20%
High-risk stock 18%
Short bond 15%
Moderate-risk stock 25%
Intermediate bond 10%
Balanced 7%
Long bond 5%
A customer who owns shares in just one fund is randomly selected.
To find the probability that the individual owns shares in a bond fund We will make use of the percentages of customers in different funds given to us.
Let B be the event:
B= ”Individual owns shares in a bond fund” and let
B1=”Individual owns shares in short bond funds”
B2=”Individual owns shares in intermediate bond funds”
B3=” Individual owns shares in long-term bond funds”
Hence we get
Probability of bond fund = short bond + Intermediate bond + long bond
⇒P(B)=P(B1)+P(B2)+P(B3)
P(B) =15%+10%+5%
P(B) =30%
P(B) =0.30
The probability that the individual owns shares in a bond fund is 0.30.
Probability And Statistics For Engineering 8th Edition Solutions Exercise 2.2 Page 62 Problem 3 Answer
Given: A mutual fund company offers its customers a variety of funds: a money-market fund, three different bond funds (short, intermediate, and long-term), two stock funds (moderate and high-risk), and a balanced fund.
Among customers who own shares in just one fund, the percentages of customers in the different funds are as follows:
Money-market 20%
High-risk stock 18%
Short bond 15%
Moderate-risk stock 25%
Intermediate bond 10%
Balanced 7%
Long bond 5%
A customer who owns shares in just one fund is randomly selected.
To find the probability that the selected individual does not own shares in a stock fund.
We will make use of the Complement proposition P(A)+P(A′)=1.
Let C be the event that:
C=”Selected individual does not own shares in a stock fund”
Probability of stock fund =high risk stock + moderate risk stock
Hence P(C)=18%+25%
P(C) =43%
P(C) =0.43
Now, using complement rule: P(A)+P(A′)=1
⇒P(A′)=1−P(A)
P( not stock fund )=1−P( stock fund )
P(C′)=1−P(C)
P(C′) =1−0.43
P(C′)=0.57
The probability that the selected individual does not own shares in a stock fund is 0.57.
Page 62 Problem 4 Answer
Given: A computer consulting firm presently has bids out on three projects.
Given: Ai={ awarded project i}
for i=1,2,3and
P(A1)=.22
P(A2)=.25
P(A3)=.28
P(A1∩A2)=.11
P(A1∩A3)=.05
P(A2∩A3)=.07
P(A1∩A2∩A3)=.01
To express in words A1∪A2 and compute its probability.We will use P(A∪B)=P(A)+P(B)−P(A∩B) to compute the probability.
To describe A1∪A2 in words as:
A1∪A2= {awarded project one or project two or both the projects}.
We know that P(A∪B)=P(A)+P(B)−P(A∩B)
Hence the probability of A1∪A2 is:
P(A1∪A2)=P(A1)+P(A2)−P(A1∩A2)
P(A1∪A2) =0.22+0.25−0.11
P(A1∪A2) =0.36
A1∪ A2 in words is described as {awarded project one or project two or both the projects}.
Probability A1∪A2 is 0.36
Page 62 Problem 5 Answer
Given: A computer consulting firm presently has bids out on three projects.
Given: Ai={ awarded project i} , for
i=1,2,3 and P(A1)=.22
P(A2)=.25
P(A3)=.28
P(A1∩A2)=.11
P(A1∩A3)=.05
P(A2∩A3)=.07
P(A1∩A2∩A3)=.01
To express A1′∩A2′ in words and compute its probability.
We will use P(A′∩B′)=P((A∪B)′)=1−P(A∪B) to compute the probability.
Describing A1′∩A2′ in words as:
A1′∩A2′={awarded project neither 1or 2}
By De Morgan’s law
(A1∪A2)′=A1′∩A2′ is given.
Now the probability of A1′∩A2′ is:
P(A1′∩A2′)=P((A1∪A2)′)=1−P(A1∪A2)
P(A1′∩A2′) =1−0.36
P(A1′∩A2′) =0.64
A1′∩A2′ in words is described as {awarded project neither 1 or 2}
Probability of A1′∩A2′ is 0.64
Chapter 2 Exercise 2.2 Probability Solved Examples Page 62 Problem 6 Answer
Given: A computer consulting firm presently has bids out on three projects.
Given: Ai={ awarded project i} for i=1,2,3 and suppose that
P(A1)=.22
P(A2)=.25
P(A3)=.28
P(A1∩A2)=.11
P(A1∩A3)=.05
P(A2∩A3)=.07
P(A1∩A2∩A3)=.01
To express A1∪A2∪A3 in words and compute its probability.
We will use P(A∪B∪C)=P(A)+P(B)+P(C)−P(A∩B)−P(A∩C)−P(B∩C)+P(A∩B∩C) to compute the probability.
Describing A1∪A2∪A3 in words as:
A1∪A2∪A3 {awarded project 1 or project 2 or project 3}.
Now the probability of A1∪A2∪A3 is:
P(A1∪A2∪A3)=P(A1)+P(A2)+P(A3)−P(A1∩A2)−P(A1∩A3)−P(A2∩A3)+P(A1∩A2∩A3)
P(A1∪A2∪A3) =0.22+0.25+0.28+0.11−0.05−0.07+0.01
P(A1∪A2∪A3) =0.53
A1∪A2∪A3 in words is described as {awarded project 1 or project 2 or project3 } Probability of A1∪A2∪A3 is 0.53.
Page 62 Problem 7 Answer
Given: A computer consulting firm presently has bids out on three projects.
Given:Ai={ awarded project i} , for i=1,2,3 and suppose that
P(A1)=.22
P(A2)=.25
P(A3)=.28
P(A1∩A2)=.11
P(A1∩A3)=.05
P(A2∩A3)=.07
P(A1∩A2∩A3)=.01
To expressA1′∩A2′∩A3′3 in words and compute its probability.We will use
P(A′∩B′∩C′)=P(A∪B∪C)′
P(A′∩B′∩C′) =1−P(A∪B∪C) to compute the probability.
Describing A1′∩A2′∩A3′ in words as:
A1′∩A2′∩A3′={none of the three projects was awarded}.
We know that
P(A′∩B′∩C′)=P(A∪B∪C)′
P(A′∩B′∩C′) =1−P(A∪B∪C)
Hence probability of A1′∩A2′∩A3′ is:
P(A1′∩A2′∩A3′)=P(A1∪A2∪A3)′
P(A1′∩A2′∩A3′) =1−P(A1∪A2∪A3)
P(A1′∩A2′∩A3′) =1−0.53
P(A1′∩A2′∩A3′) =0.47
Describing A1′∩A2′∩A3′ in words as:
A1′∩A2′∩A3′= {none of the three projects was awarded}.
We know that
P(A′∩B′∩C′)=P(A∪B∪C)′
P(A′∩B′∩C′) =1−P(A∪B∪C)
Hence probability of A1′∩A2′∩A3′ is:
P(A1′∩A2′∩A3′)=P(A1∪A2∪A3)′
P(A1′∩A2′∩A3′) =1−P(A1∪A2∪A3)
P(A1′∩A2′∩A3′) =1−0.53
P(A1′∩A2′∩A3′) =0.47
Page 62 Problem 8 Answer
Given: A computer consulting firm presently has bids out on three projects.
Given: Ai={ awarded project i}, for i=1,2,3 and suppose that
P(A1)=.22
P(A2)=.25
P(A3)=.28
P(A1∩A2)=.11
P(A1∩A3)=.05
P(A2∩A3)=.07
P(A1∩A2∩A3)=.01
To expressA1′∩A2′∩A3 in words and compute its probability.We will use P(A′∩B′∩C)=P(C)−P(A∩C)−P(B∩C)+P(A∩B∩C) to compute the probability.
Describing A1′∩A2′∩A3 in words as A1′∩A2′∩A3= {awarded project 3 and neither awarded project 1 and project 2}.
We know that: P(A′∩B′∩C)=P(C)−P(A∩C)−P(B∩C)+P(A∩B∩C)
Hence probability of A1′∩A2′∩A3 is: P(A1′∩A2′∩A3)=P(A3)−P(A1∩A3)−P(A2∩A3)+P(A1∩A2∩A3)
P(A1′∩A2′∩A3) =0.28−0.05−0.07+0.01
P(A1′∩A2′∩A3) =0.17
A1′∩A2′∩A3 in words described as {awarded project 3 and neither awarded project 1 and project 2 }.
Probability of A1′∩A2′∩A3 is 0.17
Chapter 2 Exercise 2.2 Study Guide Probability And Statistics Page 62 Problem 9 Answer
Given: A computer consulting firm presently has bids out on three projects.
Given: Let Ai={ awarded project i} , for i=1,2,3 and suppose that
P(A1)=.22
P(A2)=.25
P(A3)=.28
P(A1∩A2)=.11
P(A1∩A3)=.05
P(A2∩A3)=.07
P(A1∩A2∩A3)=.01
To express (A1′∩A2′)∪A3 in words and compute its probability.We will use P((A′∩B′)∪C)=P(A′∩B′∩C′)+P(C) to compute the probability.
Describing (A1′∩A2′)∪A3 in words as:
(A1′∩A2′)∪A3={awarded neither project 1 and project 2 or awarded project 3 }
We know that P((A′∩B′)∪C)=P(A′∩B′∩C′)+P(C)
Hence probability of (A1′∩A2′)∪A3 is:
P((A1′∩A2′)∪A3)=P(A1′∩A2′∩A3′)+P(A3)
P((A1′∩A2′)∪A3) =0.47+0.28
P((A1′∩A2′)∪A3) =0.75
(A1′∩A2′)∪A3 in words described as {awarded neither project 1 and project 2 or awarded project 3 }
Probability of (A1′∩A2′)∪A3 is 0.75 .
Page 62 Problem 10 Answer
Given: 55% of all adults regularly consume coffee, 45% regularly consume carbonated soda, and 70% regularly consume at least one of these two products.
To find the probability that a randomly selected adult regularly consumes both coffee and soda.We will make use of the property: P(A∪B)=P(A)+P(B)−P(A∩B)
Let A =Event that the elderly consumes coffee.
B=Event that adult regularly consume carbonated soda.
C=Event that adult consumes coffee, carbonated soda or both.
Hence:
P(A)=0.55
P(B)=0.45
P(C)=0.7
Now to find the probability that a randomly selected adult regularly consumes both coffee and soda means we will have to fins: P(A∩B)
We know that: P(A∪B)=P(A)+P(B)−P(A∩B)
⇒P(A∩B)=P(A)+P(B)−P(A∪B)
We can see that the event C=A∪B
Hence P(A∩B)=P(A)+P(B)−P(C)
⇒P(A∩B)=0.55+0.45−0.7
⇒P(A∩B)=0.3
The probability that a randomly selected adult regularly consumes both coffee and soda is 0.3.
Page 62 Problem 11 Answer
Given: Suppose that 55% of all adults regularly consume coffee, regularly consume carbonated soda, and 70% regularly consume at least one of these two products.
To find the probability that a randomly selected adult doesn’t regularly consume at least one of these two products.
We will use the property P((A∪B)′)=1−P(A∪B)
Let, A= Event that adult regularly consumes coffee
B=Event that adult regularly consumes carbonated soda
C=Event that adult regularly consumes coffee, soda or both
Now, the probability of these events is given as:
P(A)=0.55
P(B)=0.45
P(C)=0.7
The probability that a randomly selected adult doesn’t regularly consume at least one of these two products is the probability that the selected adult consumes only coffee or consumes only carbonated soda or does not consume both products that is (A∪B)′
Now, the probability that a randomly selected adult doesn’t regularly consume at least one of these two products is: P((A∪B)′)=1−P(A∪B)
P((A∪B)′) =1−0.7
P((A∪B)′) =0.3
The probability that a randomly selected adult doesn’t regularly consume at least one of these two products is 0.3
Probability Examples From Exercise 2.2 In Engineering And The Sciences Page 63 Problem 12 Answer
Given: A denotes the event that the next request for assistance from a statistical software consultant relates to the SPSS package and B denotes the event that the next request for assistance from a statistical software consultant relates to the SAS package.
Given:P(A)=0.30
P(B)=0.50
To check why it is not that case that P(A)+P(B)=1
There are three conditions for P(A)+P(B)=1even if one is not satisfied then the result cannot hold.
Now A and B should be complementary but It does not hold here, as these days some new programs like Python , Mat Lab are used and different people have different opinions hence SPSS and SAS are not the only events that can occur.
Therefore we can say that they are not not complementary events
Hence, it does not hold all the conditions, therefore P(A)+P(B)≠1.
We described why it is not a case that P(A)+P(B)=1.
Page 63 Problem 13 Answer
Given: A denote the event that the next request for assistance from a statistical software consultant relates to the SPSS package and:B denote the event that the next request for assistance from a statistical software consultant relates to the SAS package.
Given P(A)=0.30
P(B)=0.50
To find:P(A′).We will use: P(A)+P(A′)=1
Since for any event A we have P(A)+P(A′)=1
This implies,
P(A′)=1−P(A)
P(A′)=1−0.3
P(A′)=0.7
We calculated that P(A′)=0.7
Page 63 Problem 14 Answer
Given: A denote the event that the next request for assistance from a statistical software consultant relates to the SPSS package and B denote the event that the next request for assistance from a statistical software consultant relates to the SAS package.
Given: P(A)=0.3
P(B)=0.5
To find: P(A∪B).
We will use : P(A∪B)=P(A)+P(B)−P(A∩B)
Since A and B cannot occur at the same time, they are mutually exclusive events .
This implies that, A∩B=∅
Also, P(A∪B)=P(A)+P(B)−P(A∩B)
Then, we have P(A∪B)=P(A)+P(B)−P(∅)
Since,
P(∅)=0
P(A)=0.3
P(B)=0.5
Thus,P(A∪B)=P(A)+P(B)
P(A∪B)=0.3+0.5
P(A∪B)=0.8
We calculated that. P(A∪B)=0.8
Page 63 Problem 15 Answer
Given: A denote the event that the next request for assistance from a statistical software consultant relates to the SPSS package and B denote the event that the next request for assistance from a statistical software consultant relates to the SAS package,Given: P(A)=0.3
P(B)=0.5
From part c) we obtain: P(A∪B)=0.8
To find:P(A′∩B′).We will use: De Morgan’s law and the complement property.
Using De Morgan’s law,A′∩B′=(A∪B)′
we get,P(A′∩B′)=P((A∪B)′)
Also, since P(A)+P(A′)=1
P((A∪B)′)=1−P(A∪B)
Thus, we get, P(A′∩B′)=1−P(A∪B)
Since, P(A∪B)=0.8
Therefore,
P(A′∩B′)=1−0.8
P(A′∩B′)=0.2
We calculated that P(A′∩B′)=0.2.
Notes For Exercise 2.2 Probability In Chapter 2 Page 63 Problem 16 Answer
A box contains six 40 W bulbs , five 60W and four 75 W bulbs . Bulbs are selected at random .
To find the probability that at least two bulbs must be selected to obtain one that is rated 75W.
We will use the definition of probability and complement rule.
Consider, an event E such that
E= at least two bulbs must be selected to obtain a first 75W bulb
Then, the complementary event of E will be E′ the first bill is 75W bulb
Also, since P(E)+P(E′)=1
This implies, P(E)=1−P(E′)
Thus, P(at least two bills must be selected to obtain a first 75W bulb)
=1−P ( the first bill is 75Wbulb ).
It is given that there are:
Using probability formula, P(E′)= number of 75 W bulbs total number of bulbs
Total bills in a wallet are 5+4+6=15 bills.
Number of 75 W bulb =4
Thus, P(E′)=4/15
Therefore, P(E)=1−4/15
P(E)=11/15
P( at least two bills must be selected to obtain a first 75 W bulb)=11/15=0.7333
The probability that at least two bulbs must be selected to obtain a first 75W bulb is0.7333.
Page 63 Problem 17 Answer
Given: Total number of joints in one batch =10,000
Number of defective joints judged by Inspector A=724
Number of defective joints judged by Inspector B=751
Number of defective joints judged by at least one of the inspectors =1159.
To find the probability that the selected joint was judged to be defective by neither of the two inspectors.
Consider X= Event that selected defective joints were judged by Inspector A
Y= Event that selected defective joints were judged by Inspector B
Hence we get:
X∪Y={ selected defective joints were judged by inspectorA or B or both }
(X∪Y)′={ selected defective joints were judged neither by inspector A or B} to find P((X∪Y)′).
Since, P(E)+P(E′)=1
Then, P((X∪Y)′)=1−P(X∪Y)
Using, probability formula, we have P(X∪Y)= number of defective joints judged by at least one of the inspectors total number of joints
P(X∪Y)=1159/10000
Therefore,P((X∪Y)′)=1−1159/10000
P((X∪Y)′)=8841/10000
P((X∪Y)′)=0.8841
The probability that the selected joint was judged to be defective by neither of the two inspectors is 0.8841
Page 63 Problem 18 Answer
Given: Total number of joints in one batch =10,000
Number of defective joints judged by Inspector A=724
Number of defective joints judged by Inspector B=751
Number of defective joints judged by at least one of the inspectors=1159
To find: the probability that the selected joint was judged to be defective by the inspector B but not by inspector A.
consider X=Event that selected defective joints were judged by InspectorA
Y=Event that selected defective joints were judged by Inspector B
Hence X∪Y={selected defective joints were judged by inspectorA or B or both }
X∩Y={selected defective joints were judged by inspector A and B}
X′={selected defective joints were not judged by Inspector A}
(X′∩Y)={ selected defective joints were not judged by Inspector A and were judged by Inspector B}.i
We need to find the probability of X′∩Y.
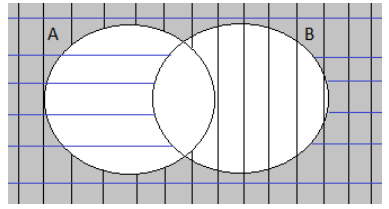
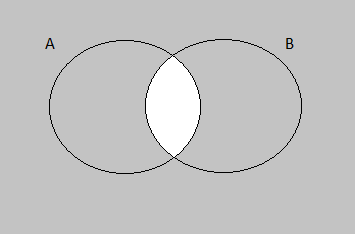
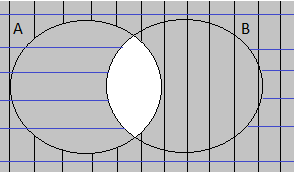
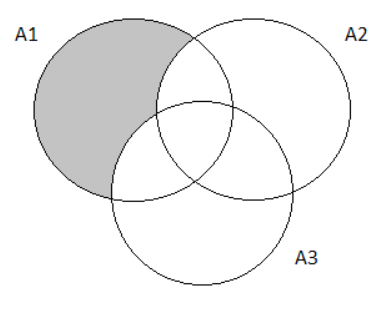
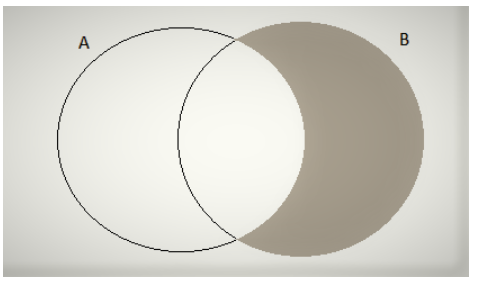
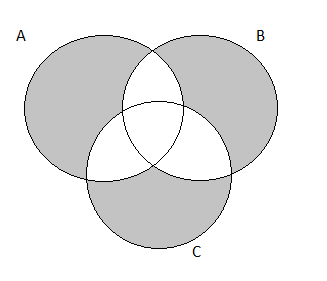
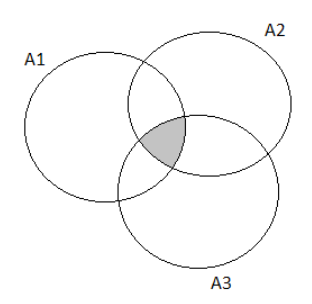
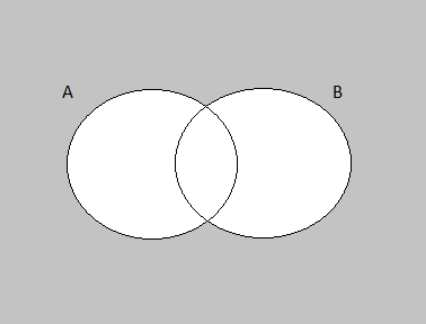
Venn diagram for(X′∩Y) i.e., the selected joint was judged to be defective by inspector B but not by inspector A is:
From the Venn Diagram above, we can observe that,
P(X′∩Y)=P(Y)−P(X∩Y)
Also, sinceP(X∪Y)=P(X)+P(Y)−P(X∩Y)
This implies, P(X∩Y)=P(X)+P(Y)−P(X∪Y)
Using probability formula, P(X)= number of defective joints judged by inspector A
Total number of joints
P(X)=724/10000
P(X)=0.0724
P(Y)= number of defective joints judged by inspector B
Total number of joints
P(Y)=751/10000
P(Y)=0.0751
P(X∪Y)= number of defective joints judged by inspector A or B or both
Total number of joints
P(X∪Y)=1159/10000
P(X∪Y)=0.1159
P(X∩Y)=0.0724+0.0751−0.1159
P(X∩Y)=0.0316
Thus, P(X′∩Y)=0.0751−0.0316
P(X′∩Y)=0.0435
The probability that the selected joint was judged to be defective by inspector B but not by inspector A=0.0435
Study Materials For Chapter 2 Exercise 2.2 In Probability Page 63 Problem 19 Answer
Given: The route used by a certain motorist in commuting to work contains two intersections with traffic signals.
Given probability to stop at the first signal: 0.4
Given probability to stop at the second signal: 0.5
Given probability to stop at at least one of the two signals: 0.6
To find the probability that he must stop at both the signals.We will use: P(A∩B)=P(A)+P(B)−P(A∪B)
Let us define event A to be when the motorist stops at the first signal with probability P(A)=0.4.
Let us also define event B to be when the motorist stops at the second signal with probability P(B)=0.5.
The probability of the event that he must stop at at least one of the two signals isP(A∩B)=0.7
By using P(A∩B)=P(A)+P(B)−P(A∪B) we get:
P(A∩B)=P(A)+P(B)−P(A∪B)
⇒P(A∩B)=0.4+0.5−0.7
⇒P(A∩B)=0.2
Hence the probability that he must stop at both of the signals is P(A∩B)=0.2.
Page 63 Problem 20 Answer
Given : The route used by a certain motorist in commuting to work contains two intersections with traffic signals.
Given probability to stop at the first signal(event A): 0.4
Given probability to stop at the second signal(event B):0.5
Given probability to stop at at least one of the two signals: 0.6
To find the probability that he must stop at the first signal but not at the second signal.We will use: P(A∩Bc)=P(A)−P(A∩B)
We are given,
⇒ P(A)=0.4
⇒ P(B)=0.5
⇒ P(A∪B)=0.7
We are asked to calculate P(A∩Bc).
Using the formula for the intersection of the event A and the complement of the event B:P(A∩Bc)=P(A)−P(A∩B)∣
Substituting the values from Step1, we get:
⇒ P(A∩Bc)=P(A)−P(A∩B)
⇒0.4−0.2
⇒0.2
Therefore the probability that he stops at the first signal but not at the second signal is P(A∩Bc)=0.2 .
Hence the probability that he stops at the first signal but not at the second signal is P(A∩Bc)=0.2 .
Page 63 Problem 21 Answer
Given: The route used by a certain motorist in commuting to work contains two intersections with traffic signals.
Given probability to stop at the first signal (event A): 0.4
Given probability to stop at the second signal(event B): 0.5
Given probability to stop at at least one of the two signals:
To find the probability that he stops at exactly one signal.
We are given,
⇒ P(A)=0.4
⇒ P(B)=0.5
⇒ P(A∪B)=0.7
We are asked to calculate
P({ at exactly one signal })=P(A∪B)−P(A∩B)
⇒P=[P(A)−P(A∩B)]+[P(B)−P(A∩B)]
Substituting values from Step1, we get:
P=[P(A)−P(A∩B)]+∣P(B)−P(A∩B)]
⇒[0.4−0.2]+[0.5−0.2]
⇒[0.2]+[0.3]
⇒0.2+0.3
⇒0.5
Therefore the probability that he will stop at exactly one signal is P=0.5.
Hence the probability that he will stop at exactly one signal is P=0.5.
Solved Problems For Exercise 2.2 In Probability And Statistics 8th Edition Page 64 Problem 22 Answer
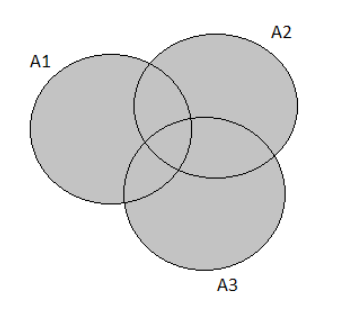
Given: The three most popular options on a certain type of new car are a built-in GPS (A), a sunroof (B), and an automatic transmission (C).
Given: Request for A: 40%
Request for B:55%
Request for C:70%
Request for A or B:63%
Request for A or C:77%
Request for B or C:85%
To determine the probability that next purchaser will request at least one of the three options.
We will use P(A∪B∪C)=P(A)+P(B)+P(C)−P(A∩B)−P(A∩C)−P(B∩C)+P(A∩B∩C)
The probability that the next purchaser will request at least one of the three options can be written as:
⇒ P(A∪B∪C)
We can also write this as: P(A∪B∪C)=P(A)+P(B)+P(C)−P(A∩B)−P(A∩C)−P(B∩C)+P(A∩B∩C)
where P(A)=0.4
⇒ P(B)=0.55
⇒ P(C)=0.70
⇒ P(A∪B)=0.63
⇒ P(A∪C)=0.77
⇒ P(B∪C)=0.85
In this step, we will calculate P(A∩B),P(A∩C),P(B∩C), and P(A∩B∩C)
⇒ P(A∩B)=P(A)+P(B)−P(A∪B)∣
⇒0.4+0.55−0.63∣
⇒0.32 I
P(A∩C)=P(A)+P(C)−P(A∪C)∣
⇒0.4+0.7−0.77∣
⇒0.33 I
P(B∩C)=P(B)+P(C)−P(B∪C)∣
⇒0.55+0.7−0.8∣
⇒0.45 I
P(A∩B∩C)=P(A∪B∪C)−P(A)−P(B)−P(C)+P(A∩B)+P(A∩C)+P(B∩C)∣
⇒0.85−0.4−0.55−0.7+0.32+0.33+0.45∣
⇒0.3
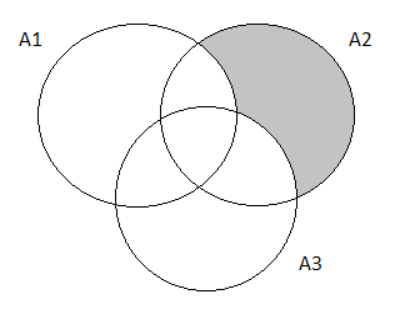
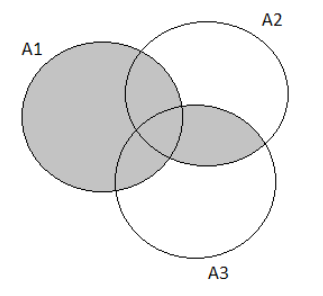
The Venn Diagram representation is:
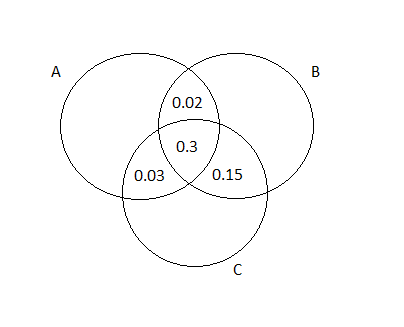
Using the formula for intersection and substituting values, we get:
P(A∪B∪C)=P(A)+P(B)+P(C)−P(A∩B)−P(A∩C)−P(B∩C)+P(A∩B∩C)∣
⇒0.4+0.55+0.7−0.32−0.33−0.45+0.33
⇒0.85
Therefore the probability that the next purchaser will request at least one of the three options is 0.85.
Hence the probability that the next purchaser will request at least one of the three options is 0.85
Page 64 Problem 23 Answer
Given: The three most popular options on a certain type of new car are a built-in GPS (A), a sunroof (B), and an automatic transmission (C). Given:
Request for A:40%
Request for B:55%
Request for C:70%
Request for A or B:63%
Request for A or C:77%
Request for B or C:85%
To determine the probability that the next purchaser will select none of the three options.
We will use: P(A∪B∪C)=P(A)+P(B)+P(C)−P(A∩B)−P(A∩C)−P(B∩C)+P(A∩B∩C)
The probability that the next purchaser will request at least one of the three options can be written as:
P(A∪B∪C)
We can also write this as:
P(A∪B∪C)=P(A)+P(B)+P(C)−P(A∩B)−P(A∩C)−P(B∩C)+P(A∩B∩C)
⇒0.4+0.55+0.7−0.32−0.33−0.45+0.33
⇒0.85
The probability of the next purchaser selecting none of the three options can be written as:
P((A∪B∪C)c)
We can also write this as:
P((A∪B∪C)c)=1−P(A∪B∪C)
⇒1−0.85
⇒0.15
The Venn Diagram for the following exercise prompt would look like this:
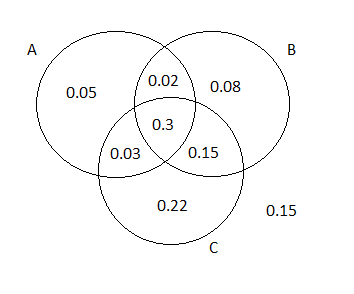
Hence the probability of the next purchaser selecting none of the three options is 0.15
Page 64 Problem 24 Answer
Given: The three most popular options on a certain type of new car are a built-in GPS (A), a sunroof (B), and an automatic transmission (C). Given:
Request for A:40%
Request for B:55%
Request for C:70%
Request for A or B:63%
Request for A or C:77%
Request for B or C:85%
To find the probability that next purchaser will request only an automatic transmission and not either of the other two options.
We will draw the Venn diagram and then solve.
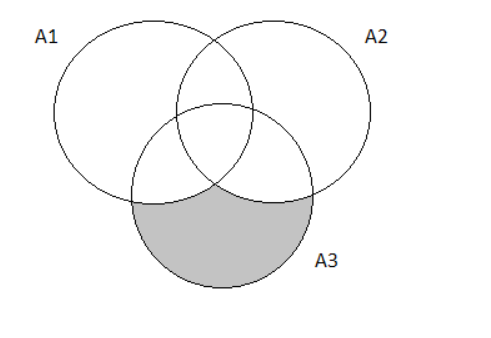
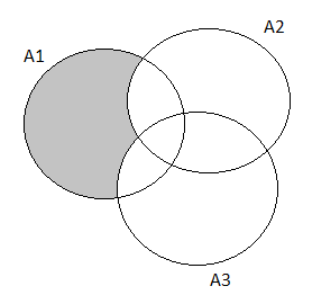
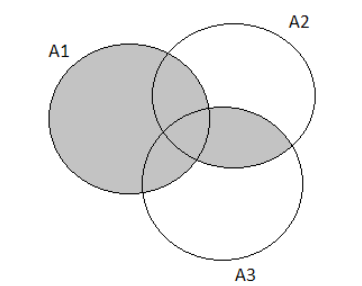
The probability that the next purchaser will request only an automatic transmission option and not either of the other two can be written as P(A′∩B′∩C)
The probability that the next purchaser will request only an automatic transmission option and not either of the other two can be written as P(A′∩B′∩C)
We can substitute the respective values:
P(A′∩B′∩C)=P(C)−P(A∩C)−P(B∩C)+P(A∩B∩C)
⇒0.7−0.33−0.45+0.3
⇒0.22
Hence the probability that the next purchaser will request only an automatic transmission option and not either of the other two options is 0.22
Probability And Statistics For Engineering 8th Edition Solutions Exercise 2.2 Page 64 Problem 25 Answer
Given: The three most popular options on a certain type of new car are a built-in GPS (A), a sunroof (B), and an automatic transmission (C).
Given: Request for A:40%
Request for B:55%
Request for C:70%
Request for A or B:63%
Request for A or C:77%
Request for B or C:85%
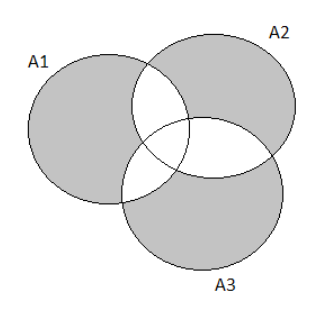
To find the probability that the next purchaser will choose exactly of the three options.
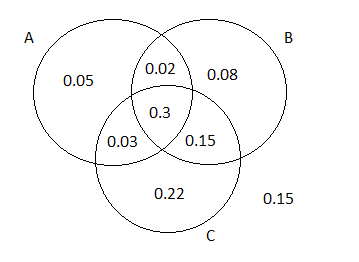
We will draw a Venn diagram and then solve.
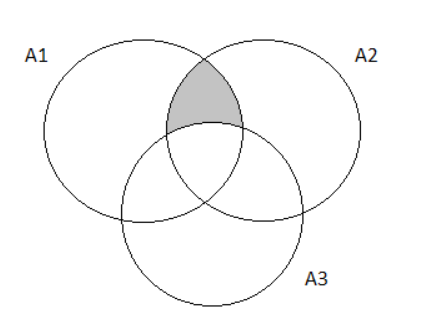
The complete Venn Diagram for the exercise prompt is:
Since we want to find the probability that the next purchaser will select exactly one of these three options, we will shade our Venn Diagram accordingly.
After shading, the resulting Venn Diagram is:
Taking the summation of the shaded area we get:
P(exactly one of the three )
⇒P(A)+P(B)+P(C)−P(A∩B)−P(B∩C)−P(A∩B)+3P(A∩B∩C)∣
⇒0.05+0.08+0.22∣
⇒0.35
Therefore the probability that the next purchaser will select exactly one of these three options is 0.35
Page 64 Problem 26 Answer
Given: An academic department with five faculty members— Anderson, Box, Cox, Cramer, and Fisher—must select two of its members to serve on a personnel review committee.
Because the work will be time-consuming, no one is anxious to serve, so it is decided that the representative will be selected by putting the names on identical pieces of paper and then randomly selecting two.
To find the probability that both Anderson and Box will be selected.
We will find the total number of events that is possible in this case.
After which we will take the total number of events of “both Anderson and Box being selected”.
Let this be denoted by P(A).We will then find P(A)
In this step, we will find the total number of sample spaces possible. The sample space in this case is:
{A,B},{A,Cox},{A,Cr},{A,F},{B,Cox}
{B,Cr},{B,F},{Cox,Cr},{Cox,F},{Cr,F}
Therefore the sample space has 10 events.
Let A= Event that both Anderson and Box are selected.
Then the events can be:{A,B}
Therefore, we can write P(A) to be: P({A,B})=1/10
Hence the probability that both Anderson and Box will be selected is 1/10.
Page 64 Problem 27 Answer
Given: An academic department with five faculty members— Anderson, Box, Cox, Cramer, and Fisher—must select two of its members to serve on a personnel review committee.
Because the work will be time-consuming, no one is anxious to serve, so it is decided that the representative will be selected by putting the names on identical pieces of paper and then randomly selecting two.
To find the probability that at least one of the two members whose name begins with C is selectedWe will find the total number of events that is possible in this case.
After which we will take the total number of events of ” at least one of the two members whose name begins with C being selected”.
Let this be denoted by P(C).We will the find P(C)
In this step, we will find the total number of sample spaces possible. The sample space in this case is:
{A,B},{A,Cox},{A,Cr},{A,F},{B,Cox},
{B,Cr},{B,F},{Cox,Cr},{Cox,F},{Cr,F}
Therefore the sample space has 10 events.
Let P(C)= Event that at least one of the two members whose name begins with C is selected.
We are told that at least one of the two members whose name begins with C is selected. Then the disjoint events can be: {A,Cox},{A,Cr},{B,Cox},{B,Cr},{Cox,Cr},{Cox,F},{Cr,F}
Therefore, we can write P(C) to be:
P(C)=P({A,Cox}+{A,Cr}+{B,Cox}+{B,Cr}+{Cox,Cr}+{Cox,F}+{Cr,F})
⇒7/10,
Hence the probability that at least one of the two members whose name begins with C is selected is 7/10 .
Chapter 2 Exercise 2.2 Probability Solved Examples Page 64 Problem 28 Answer
Given: An academic department with five faculty members— Anderson, Box, Cox, Cramer, and Fisher—must select two of its members to serve on a personnel review committee.
Because the work will be time-consuming, no one is anxious to serve, so it is decided that the representative will be selected by putting the names on identical pieces of paper and then randomly selecting two.
Given: Five faculties have taught for 3,6,7,10, and 14 years, respectively.
To find the probability that the two chosen representatives have a total of at least15 years’ teaching experience there.
We will find the total number of events that is possible in this case.
After which we will take the total number of events of “at least 15 years’ teaching experience”.
Let this be denoted by P(B). We will then find P(B)
In this step, we will find the total number of sample spaces possible. The sample space in this case is:
{3,6},{3,7},{3,10},{3,14},{6,7},{6,10},{6,14},{7,10},{7,14},{10,14}∣
Therefore the sample space has 10 events.
We are told that at least 15 years of teaching experience is required. Then the disjoint events can be:
{3,14},{6,10},{6,14},{7,10},{7,14},{10,14}
Let B= Event that representative have at least 15 years of teaching experience
Therefore, we can write P(B) to be:
P(B)=P({3,14}+{6,10}+{6,14}+{7,10}+{7,14}+{10,14})
⇒6/10
Hence the probability that the two chosen representatives have a total of at least 15 years’ teaching experience is 6/10.
Page 64 Problem 29 Answer
Given : A family consisting of three members, A, B , and C goes to a medical clinic that always has a doctor at each stations 1,2, and 3.
During a certain week each member of the family visits a clinic and is assigned a random station.
Given: Any incoming individual is equally likely to be assigned to any of the three stations irrespective of where other individuals have been assigned.
To find the probability that all three family members are assigned to the same station.We will find the total number of sample space that is possible in this case.
After which we will take the total number of events of “all the three family members are assigned to the same station”.
Let this be denoted by P(A). We will then find P(A)
In this step, we will find the total number of sample spaces possible.
Since there are 3 stations and 3 family members. Then the sample space will consist of:
⇒ n=33
⇒ n=27
Therefore the sample space is 27 events.
Let A= Event that all three family members go to the same station.
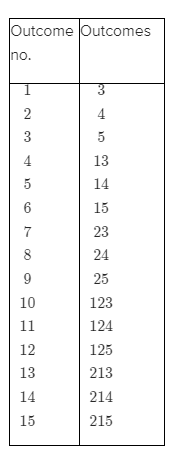
Then the events can be: (1,1,1),(2,2,2),(3,3,3)
We can write P(A) to be:
P(A)=P((1,1,1)+(2,2,2)+(3,3,3))
=3/27
⇒P(A)=1/9
Hence the probability that all three family members are assigned to the same station is 1/9.
Page 64 Problem 30 Answer
Given: A family consisting of three members, A,B , and C goes to a medical clinic that always has a doctor at each stations 1,2 and 3.
During a certain week each member of the family visits a clinic and is assigned a random station.
Given: Any incoming individual is equally likely to be assigned to any of the three stations irrespective of where other individuals have been assigned.
To find the probability that at most two family members are assigned to the same station.
We will find the total number of events that is possible in this case.
After which we will take the total number of events of “at most two family members are assigned to the same station”.
Let this be denoted by P(B). We will find the total number of events that is possible in this case.
After which we will take the total number of events of “at most two family members are assigned to the same station”.
Let this be denoted by P(B). We will then find p (B)
In this step, we will find the total number of sample spaces possible.
Since there are 3 stations and 3 family members. Then the sample space will consist of:
⇒ n=33
⇒ n=27
Therefore the sample space is 27 events.
Let B be the event that at most two family members go to the same station.
Then the events which do not follow can be:
B{c}=(1,1,1),(2,2,2),(3,3,3)
We can write P(B) as:
P(B)=1−P(Bc)
P(B)=1−1/9
P(B)=8/9
Hence the probability that at most two family members are assigned to the same station is 8/9⋅
Page 64 Problem 31 Answer
Given: A family consisting of three members, A,B , and C goes to a medical clinic that always has a doctor at each stations 1,2 and 3.
During a certain week each member of the family visits a clinic and is assigned a random station.
Given: Any incoming individual is equally likely to be assigned to any of the three stations irrespective of where other individuals have been assigned.
To find the probability that every family member is assigned to a different station.
We will find the total number of events that is possible in this case.
After which we will take the total number of events of “every family member is assigned to a different station”.
Let this be denoted by P(C). We will then find P(C)
In this step, we will find the total number of sample spaces possible.
Since there are 3 stations and 3 family members. Then the sample space will consist of:
⇒ n=33
⇒ n=27
Therefore the sample space is 27 events.
Let C be the event that every family member is assigned a different station.
Then the events can be:
(1,2,3),(1,3,2),(2,1,3),(2,3,1),(3,1,2),(3,2,1)∣
We can write P© to be P/(C)
P/(C) =P({(1,2,3),(1,3,2),(2,1,3),(2,3,1),(3,1,2),(3,2,1)}⟩
P/(C) =6/27
⇒P(C)=2/9
Hence the probability that every family member is assigned to a different station is 2/9.


 .
.