Core Connections Course 1 Student 1st Edition Chapter 2 Arithmetic Strategies and Area
Core Connections Course 1 Student 1st Edition Chapter 2 Exercise 2.1 solutions Page 55 Problem 1 Answer
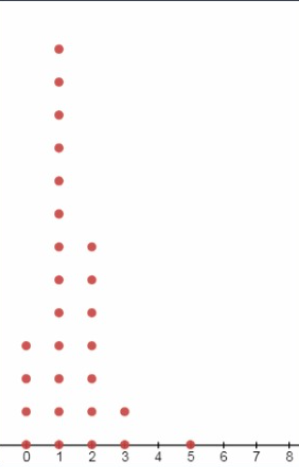
We are given a dot plot representing the number of pets students in a class have.
We have to find which number of pets have to most and least occurrences in the class.
We can do this by analyzing the dot plot.
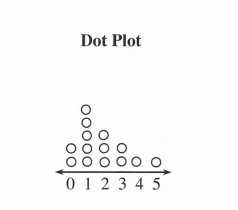
By observing the dot plot, we can see that the number 1 has the maximum number of dots above it and numbers 4,5 have the least number of dots.
Hence, 1 pet has the most occurrence in my class and 4,5 pets have the least occurrence in my class.
Read and learn More Core Connections Course 1 Student 1st Edition Solutions
1 pet has the most occurrence in my class.
4,5 pets have the least occurrence in my class.
Core Connections Course 1 Chapter 2 Page 55 Problem 2 Answer
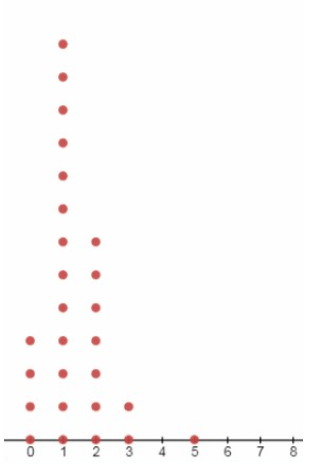
We are given a dot plot representing the number of pets students in a class have.
We have to find how many pets most students have.
We can do this by analyzing the dot plot.
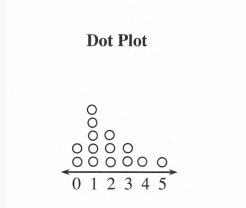
Most of the students in the class have 1 pet.
We can see this from the dot plot as there are most number of dots on top of 1 on the x axis.
Therefore, most students in class have 1 pet since there are most number of dots on top of 1 number of pets.
Core Connections Course 1 Chapter 2 Page 55 Problem 3 Answer
It cannot be detemined if two students have the same pet as the dot plot is only giving information about the number of pets and not the type of pets.
Chapter 2 Exercise 2.1 Arithmetic Strategies and Area solutions Core Connections Course 1 Page 55 Problem 4 Answer
A bar graph and a Venn diagram are made to represent the type of pets students have.
Each student can place only one dot in each of the graphs.
We have to tell if it was easy plotting dots on both graphs.
If I have only one pet either a dog or a cat, I can easily place dot on both graphs.
In the bar graph, I need to place the dot in the dog or cat bar depending on the pet I have and similarly, I can place my dot in the part of the Venn diagram which does not overlap to show that I have only one pet.
If I have both a dog and a cat, I can place a dot in the Venn diagram easily.
I will place the dot in the part of the diagram that overlaps, this shows that I have both a cat and a dog.
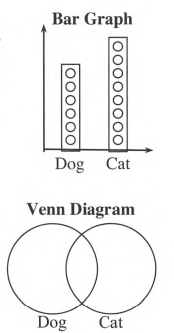
But I will not an able to represent this situation by placing only one dot in the bar graph.
So I cannot place my dot on both graphs easily if I have both a dog and a cat.
So if I have only one pet, I can easily place the dot on both graphs.
But if I have both a cat and a dog, I will not be able to place the dot on both graphs.
Core Connections Course 1 Chapter 2 Page 55 Problem 5 Answer
A bar graph and a venn diagram are made to represent the type of pets students have.
We have to tell what information can be obtained from looking at the graph and the diagram By looking at the bar graph, we can see which pet is more popular among students(cat or dog).
By looking at the venn diagram, we can see how many students have two pets and hoe many students have a single pet.
Therefore, by looking at the bar graph and the venn diagram, we can get information about the type of pets and number of pets.
Core Connections Course 1 Chapter 2 Exercise 2.1 step-by-step solutions Page 55 Problem 6 Answer
A bar graph and a venn diagram are made to represent the type of pets students have.
We have to tell what type information can be represented using bar graph and the venn diagram.
Comparative data is best represented using bar graphs. For example, we are comparing the number of cats and dogs as pets here.
Relative data is best represented using venn diagrams.
For example, number of students with two pets and single pets(cat or dog) is represented here.
Therefore, comparative information is represented using bar graphs and relative information using venn diagrams.
Core Connections Course 1 Chapter 2 Page 55 Problem 7 Answer
A bar graph and a venn diagram are made to represent the type of pets students have.
We have to find out if the order of bars in the bar graph matters.
We can do this by analyzing the bar graph.
No, the order of bars in the bar graph does not matter.
It is because the data is represented in the same manner irrespective of the order of the bars.
For example, the data being conveyed does not change even if cats bar is drawn before dogs bar.
Therefore, the order of bars in a bar graph does not matter.
Core Connections Course 1 Chapter 2 Exercise 2.1 step-by-step solutions Page 56 Problem 8 Answer
Given some tabular data.
We have to find out the best way to represent that data.
We can do this by analyzing the data given.
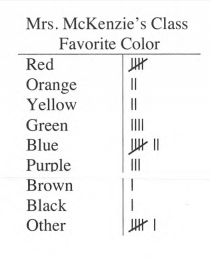
For the given data, a bar graph would be best suited as the number of students with that particular favorite color is given and hence each of those colors can be represented as a bar in the bar graph.
Bar graph is best here as the given data is comparative data.
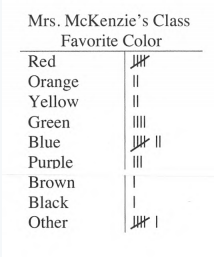
Therefore, a bar graph is the best way to represent the given data among dot plot, bar graph, or Venn diagram.
Core Connections Course 1 Chapter 2 Page 56 Problem 9 Answer
Given some data about the number of siblings the students in a class had.
We have to decide whether if a bar graph or a dot plot will work best and create it.
We can do it using the given data.
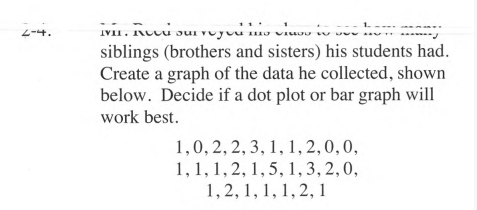
Since the given data only contains values about number of siblings, the best way to describe it would be a dot plot.
After making the dot plot with the given values, the graph would look like –
Therefore, the best way to represent the given data is a dot plot.
Solutions For Core Connections Course 1 Chapter 2 Exercise 2.1 Arithmetic Strategies and Area Page 56 Problem 10 Answer
We have drawn various kinds of graphs like dot plots, bar graphs and venn diagrams.
We have to now compare these graphs.
We can do it by studying all these types of graphs.
Differences between dot plots and bar graphs –
Bar graphs gather data into categories, allowing you to quickly compare values for each category.
A dot plot shows each item of numerical data above a number line or horizontal axis.
Dot plots make it easy to see gaps and clusters in a data set, as well as how the data spreads along the axis.
Bar graphs and venn diagrams –
A bar chart or bar graph is a chart or graph that presents categorical data with rectangular bars with heights or lengths proportional to the values that they represent.
A Venn diagram is an illustration that uses circles to show the relationships among things or finite groups of things.
Circles that overlap have a commonality while circles that do not overlap do not share those traits.
Therefore, different types of graphs have different types of applications and properties.
Core Connections Course 1 Chapter 2 Page 57 Problem 11 Answer
Given data about the appliances sold during the month of September.
We have to decide the best type of graph to represent that data.
We can do this by analyzing the data.
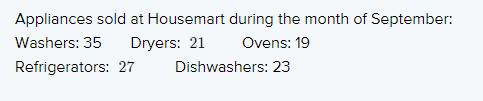
From the given data, we can see that the the sales numbers are large.
Hence it would be best to use a bar graph since we can use a scale and represent the data clearly.
If we used a dot plot, the number of dots would be a lot and the graph would be really big.
Therefore the graph made will be –
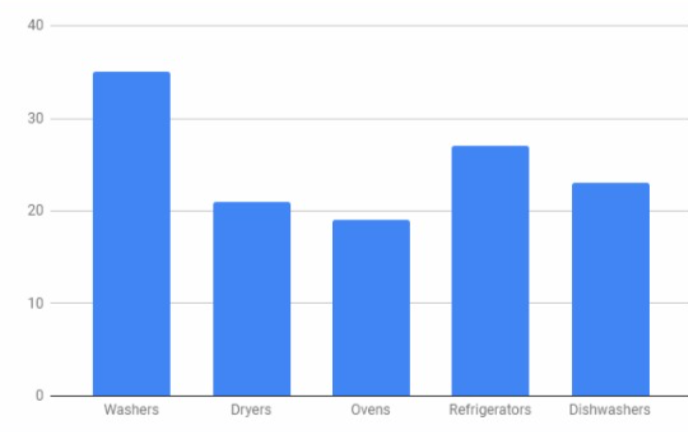
Therefore, the best way to represent the given data is using a bar graph, because the numbers are large and it would not be convenient to use a dot plot.
Core Connections Course 1 Student 1st Edition Chapter 2 Exercise 2.1 guide Page 57 Problem 12 Answer
Number of tiles is given six.
It is required to find a pattern where the number of toothpicks is more than double the number of tiles.
To increase the number of toothpicks more than double the number of tiles we should increase the length of the pattern.
The pattern having the number of toothpicks is more than double the number of tiles is drawn below :
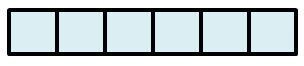
Notice the pattern,
Number of tiles =6
Number of toothpicks = 14
Thus, the number of toothpicks is more than double the number of tiles
Hence the pattern having the number of toothpicks is more than double the number of tiles is drawn below :

Core Connections Course 1 Chapter 2 Page 57 Problem 13 Answer
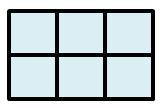
Number of tiles is given six.It is required to find a pattern where the number of toothpicks is four more than the number of tiles.
To find a pattern where the number of toothpicks is four more than the number of tiles we should decrease the length of pattern.
The pattern where the number of toothpicks is four more than the number of tiles is drawn below :

Notice the pattern,
Number of tiles =6
Number of toothpicks = 10
Thus, the number of toothpicks is four more than the number of tiles.
Hence the pattern where the number of toothpicks is four more than the number of tiles is drawn below :
Chapter 2 Exercise 2.1 Arithmetic Strategies and Area Explained Core Connections Course 1 Page 57 Problem 14 Answer
Cost of one fruit kabobs and one smoothie are given$1.75 and $2.50 respectively.
It is required to find total cost of two fruit kabobs and one smoothie.
Find the cost of two fruit kabobs and one smoothie separately and add them to get total cost.
Cost of two fruit kabobs =2⋅1.75
=$3.50
Cost of one smoothie =1⋅2.50
=$2.50
Total cost=$3.50+$2.50
=$6.00
Hence Leo have to pay $6.00 for ordering two fruit kabobs and one smoothie.
Core Connections Course 1 Chapter 2 Page 57 Problem 15 Answer
Cost of one fruit kabobs and one smoothie are given$1.75 and $2.50 respectively.
It is required to find total cost of three fruit kabobs and four smoothies.
Find the cost of three fruit kabobs and four smoothies separately and add them to get total cost.
Cost of three fruit kabobs=3⋅1.75
=$5.25
Cost of four smoothies=4⋅2.50
=$10.00
Total cost=$5.25+$10.00
=$15.25
Hence Stefano have to pay$15.25 for ordering three fruit kabobs and four smoothies.
Free Core Connections Course 1 Chapter 2 Exercise 2.1 Arithmetic Strategies and Area Solutions Page 57 Problem 16 Answer
Cost of one fruit kabob and one smoothie are given $1.75 and $2.50 respectively.
It is required to show at least three possibilities of spending $9.00 for ordering fruit kabobs and smoothies.
Select the number of kabobs and smoothies such that its total cost doesn’t exceed $9.00.
First possibility :
Arturo can order one fruit kabobs and two smoothies.
Total cost of one fruit kabobs and two smoothies=1⋅1.75+2⋅2.50
=$6.75
Notice total cost of one fruit kabobs and two smoothies is less than $9.00.
Thus, Arturo can afford ordering one fruit kabobs and two smoothies.
Second possibility :
Arturo can order three fruit kabobs and one smoothies.
Total cost of three fruit kabobs and one smoothies=3⋅1.75+1⋅2.50
=$7.75
Notice total cost of three fruit kabobs and one smoothies is less than$9.00.
Thus, Arturo can afford ordering three fruit kabobs and one smoothies.
Third possibility :
Arturo can order two fruit kabobs and two smoothies.
Total cost of two fruit kabobs and two smoothies=2⋅1.75+2⋅2.50
=$8.50
Notice total cost of two fruit kabobs and two smoothies is less than $9.00.
Thus, Arturo can afford ordering two fruit kabobs and two smoothies.
Hence three possible combinations of fruit kabobs and smoothies that Arturo could afford is :
- One fruit kabobs and two smoothies
- Three fruit kabobs and one smoothies
- Two fruit kabobs and two smoothies
Core Connections Course 1 Chapter 2 Page 57 Problem 17 Answer
Given expression 53.199−27.61
It is asked to find the value of the expression We use the decimal rules for addition and subtraction
Given expression 53.199−27.61
=53.199−27.610
=25.589
Thus the value after subtracting the two items is 25.589
Thus the value of the expression 53.199−27.61 is 25.589
How To Solve Core Connections Course 1 Chapter 2 Exercise 2.1 problems Page 57 Problem 18 Answer
Given the expression 155.96+56.232
It is asked to find the value of the expressionWe use the rules of decimal point operations to find the value.
Given expression 155.96+56.232
Making the number of digits after the decimal point same we have
155.96+56.232
=155.960+56.232
=212.192
Thus the value of the expression is 212.192
Thus the value of the expression 155.96+56.232=212.192
Core Connections Course 1 Chapter 2 Page 57 Problem 18 Answer
Given the expression 83.617−36.518
It is asked to find the value of the expression.
We use the rules of decimal operations to find the value for the same
Given the expression
83.617−36.518
=47.099
Hence the value of the expression is 47.099
Therefore the value of the expression 83.617−36.518 is 47.099
Worked Examples For Core Connections Course 1 Chapter 2 Exercise 2.1 Arithmetic Strategies And Area Page 58 Problem 19 Answer
Given an experiment where we count till 60 with our eyes closedIt is asked to answer a few questions regarding the experiment We use the concepts of data collection and its impacts to answer the questions
The students will be more accurate at estimating a lesser time period aka 10 seconds than 60 seconds or 200 seconds because as the duration increases estimation becomes harder and less accurate.
Any sort of disturbance (like noise etc) will impact the quality of data and make the estimation incorrect.
For a shorter duration, the estimate of the entire class will be more or less the same
Hence we have deduced that for shorter time periods with less disturbance, the estimations will be more accurate.
Core Connections Course 1 Chapter 2 Page 59 Problem 20 Answer
Given an experiment where students estimate how long 60 seconds are without opening their eyes.
We are asked to find ways to organize this data.
We try to find the most effective way such that the data makes sense and is easily readible.
The experiment requires students to count 60 seconds without actually seeing the clock.
The shorter the duration under experimentation the better the results will be given disturbance-free environments.
Now the data collected can be written in tabular form with the correct unit of measurements aka seconds.
Another thing one can ensure is to have the data with the same number of digits after the decimal point and probably in an increasing or decreasing order to make it easily readable
Thus noting the data in a tabular form in an increasing or descending order will make data easily interepretable.
Core Connections Course 1 Chapter 2 Exercise 2.1 Detailed Answers Page 59 Problem 21 Answer
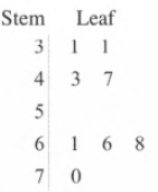
Given data stored in stem leaf format as below
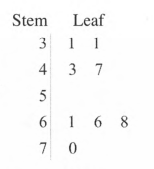
It is asked to analyze this data plotWe use the understanding behind the stem and leaf plot to analyze.
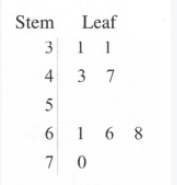
Step and leaf plot is generally a method of data plotting used in statistics where we digit each data element into a leaf or the ending/last digits and a stem or the beginning or leading digits.
The stem part acts as the key to the table which when combined with the leaf gives us the entire data element.
Example: 31,31,43,47,61,66,68,70
Dividing leaf and stem
3∣1
3∣1
4∣3
4∣7
6∣1
6∣6
6∣8
7∣0
Thus if we want to add 42 in it it will be
42=4∣2
And 102 will be
102=10∣2
Now the space after 5 is empty because their is no data item in the dataset that is between 50-59
Thus we observed the stem leaf plot where the stem is the key to the tabular data and leaf the ending digits
Core Connections Course 1 Chapter 2 Page 59 Problem 22 Answer
Given;
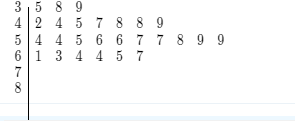
We need to arrange the class data problem 2-11 organized as stem and leaf plot.For this, we use the concept of stem & leaf plot.
Consider the class data for 2-11 as: 35,38,39,42,44,45,47,48,48,49,54,54,55,56,56,57,57,58,58,59,59,61,63,64,64,65,67.
So, here stems are3,4,5,6.
Basically, the leaves are the digits at units place and the stem is the number obtained by removing the units digit.
Corresponding to 3 leaf is5,8,9.
Corresponding to 4 leaf is2,4,5,7,8,8,9
Corresponding to 5 leaf is4,4,5,6,6,7,7,8,8,9,9
Corresponding to 6 leaf is1,3,4,4,5,7
There is no leaf corresponding to 7 & 8 because we only have1−60 min in time.
So, the class data from problem 2-11 is organized as stem and leaf plot as shown below.
So, stem leaf plot is:-3
Core Connections Course 1 Student 1st Edition Chapter 2 Exercise 2.1 Area Answers Page 59 Problem 23 Answer
Given;
To determine what do we notice about the class data.
For this we observe the class data.
We can observe the following points about the class data.
(1) None of the students were able to guess exactly when 60 seconds were over.
(2) Three students guessed the data with error of±1 second.
(3) Only three students approximated 60 seconds when it was actually 30−40 seconds.
So, we observe that :
(1) No students guess when 60 seconds were over.
(2) Three students guessed the data with error of±1 second.
(3) When it was actually30−40 seconds only three students approximated 60 seconds .
Core Connections Course 1 Chapter 2 Page 61 Problem 24 Answer
Given: A sequence of numbers; 5, 14, 23, 32, 41, ___, ___, ___
It is asked to find the missing numbers.
We use the concept of Arithmetic Progression to find out the missing terms.
Given the sequence of terms:5, 14, 23, 32, 41, ___, ___, ___
We observe that 14−5=9
23−14=9
32−23=9
41−32=9
Since all of the terms have a constant difference of ‘9’, they are following an Arithmetic Progression.
Here, a=5(starting term) and d=9(common difference)
Therefore, the next terms would be 41+9=50, similarly,
50+9=59
59+0=68
Thus the missing terms are 50, 59, and 68.
Therefore, the sequence is 5, 14, 23, 32, 41, 50, 59, 68
Core Connections Course 1 Student 1st Edition Chapter 2 Exercise 2.1 Area Answers Page 61 Problem 25 Answer
Given: A sequence of numbers; 3, 6, 12, 24, 48, ___, ___, ___
It is asked to find the missing numbers.
We use the concept of Geometric Progression to find out the missing terms.
Given the sequence of terms 3, 6, 12, 24, 48, ___, ___, ___
We observe that 6/3=2
12/6=2
24/12=2
48/24=2
Since all of the terms have a constant ratio of ‘2’, they are following a Geometric Progression.
Here, a=3
(starting term) and r=2(common ratio).
Therefore, the next terms would be; 48×2=96
96×2=192
192×2=384
Thus the missing terms are 96, 192 and 384.
Therefore, the sequence is 3, 6, 12, 24, 48, 96, 192, 384.
Core Connections Course 1 Chapter 2 Page 61 Problem 26 Answer
In the given histogram the data is divided into intervals of 2.
The number of people who eat dinner(the response from students) is plotted on X-axis.
The number of responses is plotted on the Y-axis.
The number of students is nothing but the sum of the number of responses corresponding to their respective class intervals.
Number of responses in class
0−2=2
3−4=3
5−6=5
7−8=5
9−10=1
Thus the total is 2+3+5+5+1=16
Therefore, the number of students who were surveyed is 16.
Core Connections Course 1 Student 1st Edition Chapter 2 Exercise 2.1 Area Answers Page 61 Problem 27 Answer
In the given histogram the data is divided into intervals of 2.
The number of people who eat dinner(the response from students) is plotted on X-axis.
The number of responses is plotted on the Y-axis The interval containing eight or nine people at home for dinner is the last interval i.e., 8-10 interval. The size of this interval is 1.
Therefore, the number of classmates with eight or nine people at home for dinner is 1.
Core Connections Course 1 Chapter 2 Page 61 Problem 28 Answer
In the given histogram the data is divided into intervals of 2.
The number of people who eat dinner(the response from students) is plotted on X-axis.
The number of responses is plotted on the Y-axis.
The highest number of responses i.e., 5, is received for both the intervals 4−6 as well as 6−8
Therefore the most common number of people at home for dinner are 4-8
Core Connections Course 1 Student 1st Edition Chapter 2 Exercise 2.1 Area Answers Page 61 Problem 29 Answer
Given that in each bag, Maria put three small chocolate candies and four hard candies.
It is asked to find the total number of cadies she has in 12 such bagsWe use the unitary method to find the value to this, as she has 7 candies in total in each bag
Hence, the number of candies in a single bag is 3+4=7
If Maria had 12 bags, then the total number of candies would be 12×7=84
Therefore, Maria used a total of 84 candies.
Core Connections Course 1 Chapter 2 Page 61 Problem 30 Answer
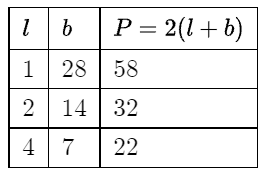
We have to explain how many different rectangles can you draw with an area (number of “tiles”) of 28.
We have to determine what is the perimeter (number of “toothpicks”) of each one.
We will use the area of a perimeter = 2(length + width).
Let l be the number of rows and b be the number of columns for the arrangement of tiles.
Then for an area of 28, the below combinations of rows and columns as length and width of rectangles works.
Thus we see that we can draw 3 different rectangles with 28 tiles.