
Glencoe Math Course 2 Volume 1 Common Core Chapter 1 Ratios and Proportional Reasoning
Glencoe Math Course 2 Volume 1 Chapter 1 Exercise 1.5 Solutions Page 45 Exercise 1 Problem 1
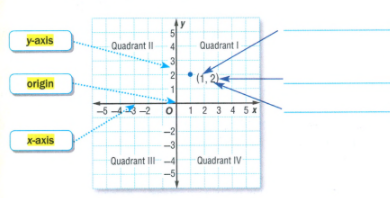
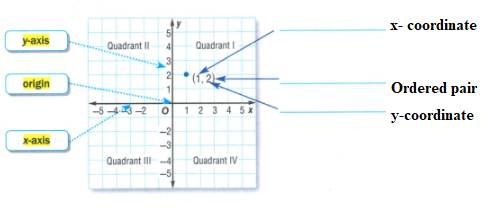
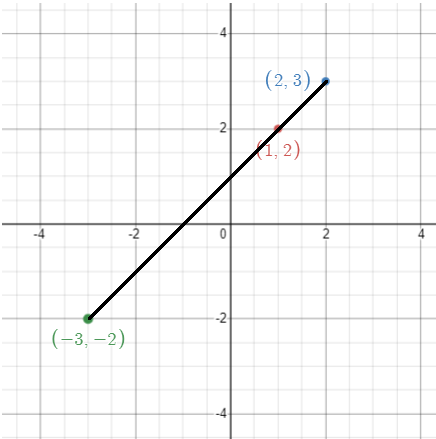
We need to label the given coordinate plane with the terms ordered pair, x-coordinate, and y-coordinate.
We need to graph the points(2,3) and (−3,−2) and to connect the three points on the coordinate plane.
The point which is already there on the graph is (1,2)
Labeling the mentioned blanks, we get

Graphing the points (2,3),(−3,−2) on the graph and connecting the three points on the coordinate plane, we get,
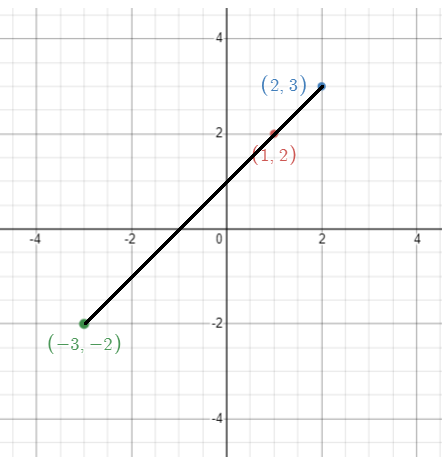
The obtained graph is a straight line.
Read and Learn More Glencoe Math Course 2 Volume 1 Common Core Student Edition Solutions
Labeling the coordinate plane below
Graphing the points and connecting them on the coordinate plane
Glencoe Math Course 2 Volume 1 Common Core Chapter 1 Page 48 Exercise 1 Problem 2
Given the cost of 3-D movie tickets is $12 for 1 ticket, $24 for 2 tickets, and $36 for 3 tickets.
We need to determine whether the cost is proportional to the number of tickets by graphing on the coordinate plane.
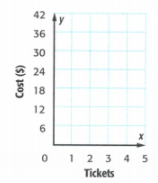
Make a table to find the cost of tickets for 1,2 and 3 members.

Now, graph the ordered pairs (tickets, cost) on the coordinate plane. Then, connect the points together.
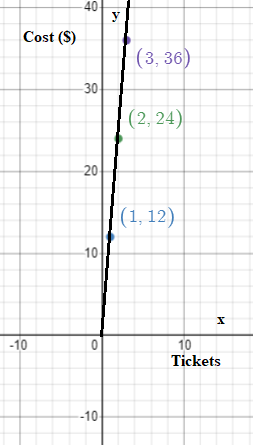
The line passes through the origin and it is a straight line.
Therefore, the cost is proportional to the number of tickets.
The cost is proportional to the number of tickets.

Common Core Chapter 1 Ratios And Proportional Reasoning Exercise 1.5 Answers Page 48 Exercise 2 Problem 3
Given that, the number of books the two stores sell after 1,2, and 3 days is shown.
We need to find which book sale represents a proportional relationship between time and books.
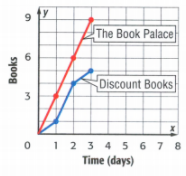
The given graph is

The graph for Discount books is not a straight line.
Hence, the relationship is not proportional.
The graph for The Book Palace is a straight line that passes through the origin.
Hence, it represents a proportional relationship between time and books. The Book Palace represents a proportional relationship between time and books.
Glencoe Math Course 2 Volume 1 Common Core Chapter 1 Page 48 Exercise 3 Problem 4
At first, we need to graph the ordered pairs (x,y) on the coordinate plane.
The x – represents the x−coordinate point.
The y- represents the y−coordinate point.
After graphing the ordered pairs, determine whether the graph obtained is a straight line or not.
If it was not a straight line, then the relationship is not proportional to each other.
If it is a straight line, check whether the straight line passes through the origin or not.
If the straight line passes through the origin, then the relationship is proportional to each other.
In this way, we can find the proportional relationship between the quantities.
If the graph represents the straight line that passes through the origin, then the quantities are said to be proportional. In this way, the graphing relationships help you determine whether the relationship is proportional or not.
Page 49 Exercise 1 Problem 5
Given that, we need to determine whether the relationship between the two quantities shown in the table is proportional by graphing on the coordinate plane.
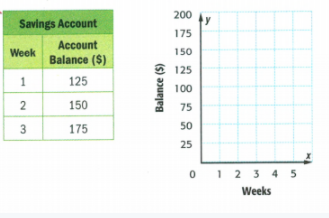
The given table is
Now, graph the ordered pairs (weeks, balance) on the coordinate plane. Then, connect the points together.
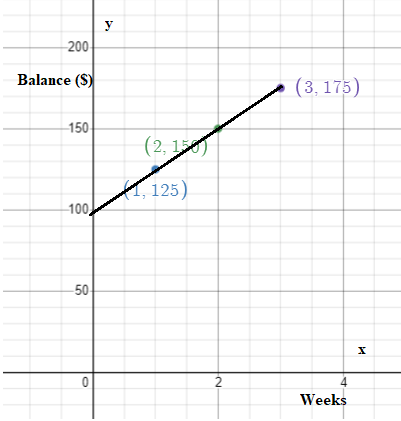
The line doesn’t pass through the origin and it is a straight line.
Thus, the number of weeks is not proportional to the account balance.
The number of weeks is not proportional to the account balance.

Step-by-step guide for Glencoe Math Chapter 1 Exercise 1.5 problems Page 49 Exercise 2 Problem 6
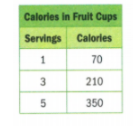
Given that, we need to determine whether the relationship between the two quantities shown in the table is proportional by graphing on the coordinate plane.
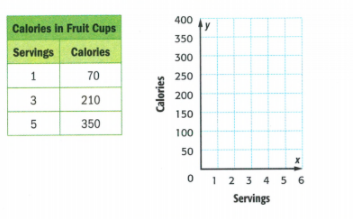
The given table is

Now, graph the ordered pairs (servings, calories) on the coordinate plane. Then, connect the points together.
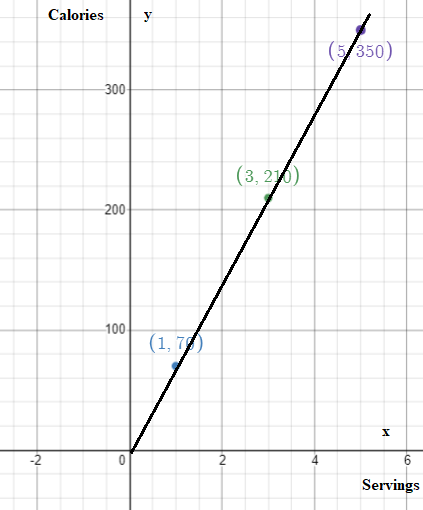
The line passes through the origin and it is a straight line.
Thus, the number of servings is proportional to the calories.
The number of servings is proportional to the calories.
Glencoe Math Course 2 Volume 1 Common Core Chapter 1 Page 49 Exercise 3 Problem 7
Given that the height of two plants is recorded after 1,2, and 3 weeks as shown in the graph at the right.
We need to determine which plants’ growth represents a proportional relationship between time and height.
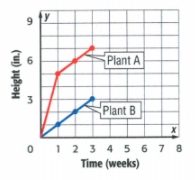
The given graph is

The graph for Plant A is not a straight line.
Hence, the relationship is not proportional.
The graph for Plant B is a straight line that passes through the origin.
Hence, it represents a proportional relationship between time and height.
Plant B’s growth represents a proportional relationship between time and height.
Exercise 1.5 Glencoe Math Course 2 Ratios And Proportional Reasoning Solutions Explained Page 50 Exercise 4 Problem 8
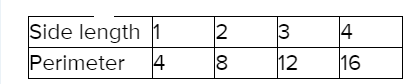
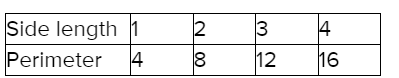
Given that, the perimeter of a square is 4 times as great as the length of any of its sides.
We need to find if the perimeter of a square is proportional to its side length.
Given that, Perimeter P = 4a
Let a = Length of the sides.
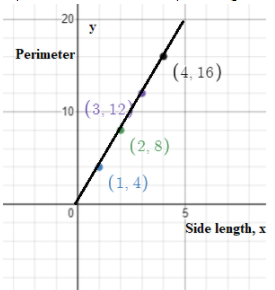
Make a table to find the perimeter for the side’s length1,2,3, and 4
Now, graph the ordered pairs (side length, perimeter) on the coordinate plane. Then, connect the points together.
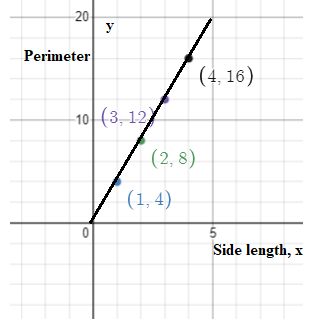
The line passes through the origin and it is a straight line.
Therefore, the perimeter of a square is proportional to its side length.
The perimeter of a square is proportional to its side length.
Glencoe Math Course 2 Volume 1 Common Core Chapter 1 Page 50 Exercise 5 Problem 9
Given that, a health club charges $35 a month for membership fees.
We need to determine whether the cost of membership is proportional to the number of months.
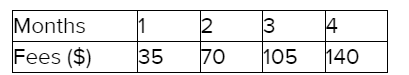
Make a table to find the membership fees for 1,2,3 and 4 months.
Now, graph the ordered pairs (months, fees) on the coordinate plane. Then, connect the points together.
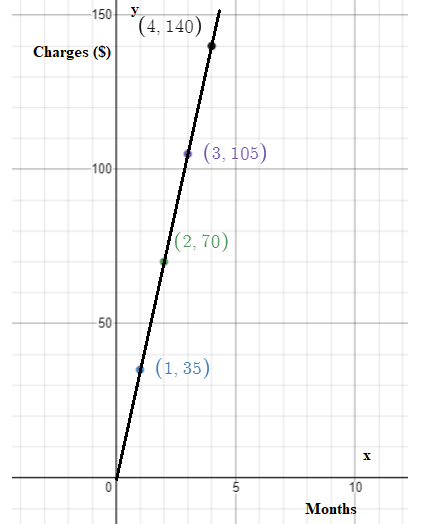
The line passes through the origin and it is a straight line.
Therefore, the cost of membership is proportional to the number of months.
The cost of membership is proportional to the number of months.
Examples Of Problems From Exercise 1.5 Ratios And Proportional Reasoning Chapter 1 Page 50 Exercise 6 Problem 10
We need to describe some data that when graphed would represent a proportional relationship.
Let us assume that the perimeter of a square is 4 times as great as the length of any of its sides.
We need to find if the perimeter of a square is proportional to its side length.
Now, graph the ordered pairs (side length, perimeter) on the coordinate plane. Then, connect the points together.
The line passes through the origin and it is a straight line.
Therefore, the perimeter of a square is proportional to its side length.
The perimeter of a square is proportional to its side length.
Glencoe Math Course 2 Volume 1 Common Core Chapter 1 Page 50 Exercise 7 Problem 11
Given that the greenhouse temperatures at certain times are shown in the table.

The greenhouse maintains temperatures between 65 degrees Fahrenheit and 85 degrees Fahrenheit and the temperature increases at a constant rate.
We need to create a graph of the time and temperatures at each hour from 1:00 P.M. to 8:00 P.M. and check whether the relationship is proportional.
The given table is
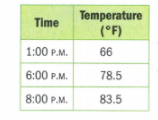
Now, graph the ordered pairs (time, temperature) on the coordinate plane. Then, connect the points together.

The line doesn’t pass through the origin and it is a straight line.
Therefore, the relationship is not proportional.
The time is not proportional to the temperature in Fahrenheit.
Student Edition Glencoe Math Chapter 1 Exercise 1.5 answers guide Page 50 Exercise 8 Problem 12
The graph is
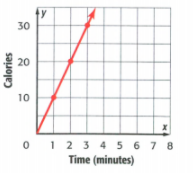
Given graph represents the Calories burned for exercising for various numbers of minutes are shown in the graph.
We need to determine which of the below statement about the graph is not true.
The statements are
(A) The number of Calories burned is proportional to the number of minutes spent exercising.
(B) The number of Calories burned is not proportional to the number of minutes spent exercising.
(C) If the line were extended, it would pass through the origin.
(D) The line is straight.
The given graph is

The given graph is a straight line.
It also passes through the origin.
Thus, the time in minutes is proportional to the number of calories represented in the graph.
Thus, the relationship between the two quantities is proportional.
The incorrect statement among them is “The number of Calories burned is not proportional to the number of minutes spent exercising.”
The Calories burned for exercising for various numbers of minutes are shown in the graph. Statement (B) about the graph is not true. (B) The number of Calories burned is not proportional to the number of minutes spent exercising.
Glencoe Math Course 2 Volume 1 Common Core Chapter 1 Page 51 Exercise 12 Problem 13
Given that, Frank and Allie purchased cell phone plans through different providers.
Their costs for several minutes are shown.
We need to graph each plan to determine whose plan is proportional to the number of minutes the phone is used
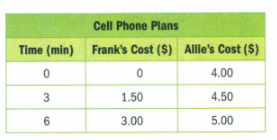
The given table is

Now, graph the ordered pairs (time, cost) on the coordinate plane.
Then, connect the points together.
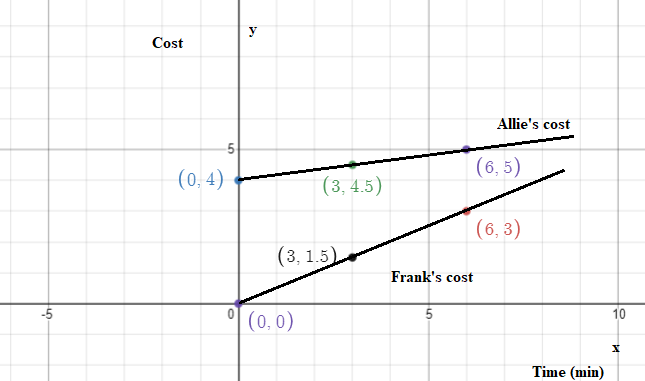
For frank, the line passes through the origin and it is a straight line.
Therefore, the relationship is proportional.
For Allie, the line doesn’t pass through the origin and it is a straight line.
Therefore, the relationship is not proportional.
Frank’s plan is proportional to the number of minutes the phone is used.
Chapter 1 Exercise 1.5 Glencoe Math Course 2 step-by-step solutions Page 52 Exercise 13 Problem 14
We need to determine whether the relationship between the number of heartbeats and the time shown in the graph is proportional.

The given graph is
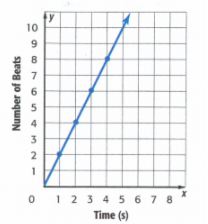
The graph given is a straight line that passes through the origin.
Hence, it represents a proportional relationship between the number of heartbeats and the time.
The relationship between the number of heartbeats and the time shown in the graph is proportional.
Glencoe Math Course 2 Volume 1 Common Core Chapter 1 Page 52 Exercise 14 Problem 15
We need to the graph below and to determine which of the following ordered pairs represent the unit rate.

The given ordered pairs are
(A) (0,0)
The unit rate is generally defined for only one quantity.
Here, the quantity is zero.
Thus, it cannot be the unit rate.
(B) (1,2)
Here, it represents for each second, the number of heartbeats is two.
Thus, this ordered pair represents the unit rate.
(C) (2,4)
Here, it represents for two seconds, and the number of heartbeats is four.
Thus, this ordered pair doesn’t represent the unit rate.
(D) (3,6)
Here, it represents for three seconds, and the number of heartbeats is six.
Thus, this ordered pair doesn’t represent the unit rate.
The ordered pair (B) (1,2) represents the unit rate.
Page 52 Exercise 17 Problem 16
Given that, a car dealership has 55 cars and 11 Vans.
We need to determine the ratio of cars to vans.
Number of cars = 55
Number of vans = 11
The ratio of cars to vans is
\(\frac{\text{Cars}}{\text{Vans}}\) = \(\frac{55}{11}\)
= \(\frac{5}{1}\)
The ratio of cars to vans is = 5:1
The ratio of cars to vans is 5:1
Glencoe Math Course 2 Volume 1 Common Core Chapter 1 Page 52 Exercise 18 Problem 17
Given that, a drawer has 4 red shirts and 8 green shirts.
We need to determine the ratio of red shirts to the total number of shirts.
Number of red shirts = 4
Number of green shirts = 8
The ratio of red shirts to the total number of shirts is
\(\frac{\text{Red shirts}}{\text{Total shirts}}\) = \(\frac{4}{4+8}\)
= \(\frac{4}{12}\)
= \(\frac{1}{3}\)
= 1:3
The ratio of red shirts to the total number of shirts is 1:3
Page 52 Exercise 19 Problem 18
Given that, a store sells 13 coffees and 65 hot chocolates.
We need to determine the ratio of coffee to hot chocolates.
Number of coffees = 13
Number of hot chocolates = 65
The ratio of coffee to hot chocolates is
\(\frac{\text{Cofees}}{\text{Hot chocolates}}\) = \(\frac{13}{65}\)
= \(\frac{1}{5}\)
= 1:5
The ratio of coffee to hot chocolates is 1:5
Page 54 Exercise 1 Problem 19
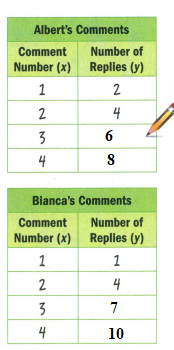
We need to determine whether Albert’s graph represents a proportional relationship or Bianca’s.
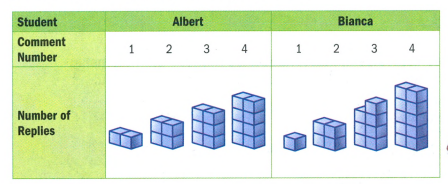
Make a table with the given information, we get
Now, graph the ordered pairs on the coordinate plane. Then, connect the points together
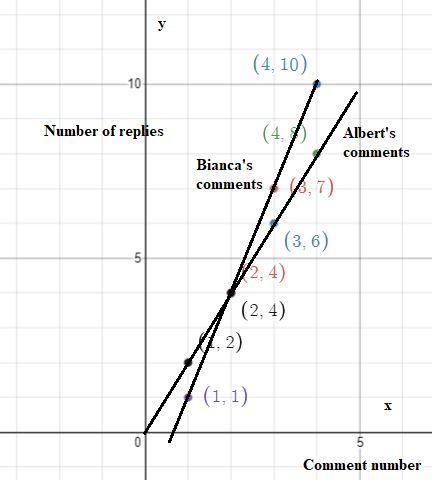
The graph for Bianca’s comments is a straight line but doesn’t pass through the origin.
Hence, the relationship is not proportional.
The graph for Albert’s comments is a straight line that passes through the origin.
Hence, it represents a proportional relationship between comment number and replies.
Albert’s graph represents a proportional relationship while Bianca’s doesn’t.
Glencoe Math Course 2 Volume 1 Common Core Chapter 1 Page 54 Exercise 2 Problem 20
The proportionality of two different quantities can easily be determined by using constant ratios.
The constant ratios indicate that the value of the ratios is all the same.
If the ratios are constant, then the ratios are said to be proportional to each other.
When two ratios are equal, it is said to be in proportion.
Let the two ratios be a:b and c:d
If both the ratios are equal, a:b = c:d
Then the given ratio is said to be in proportion.
Two quantities are said to be in proportion if they have the same ratios. This makes their ratios be in proportion.
Page 54 Exercise 3 Problem 21
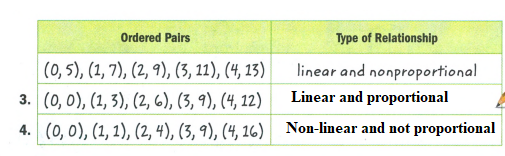
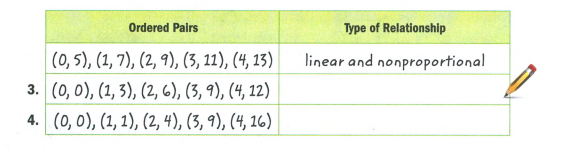
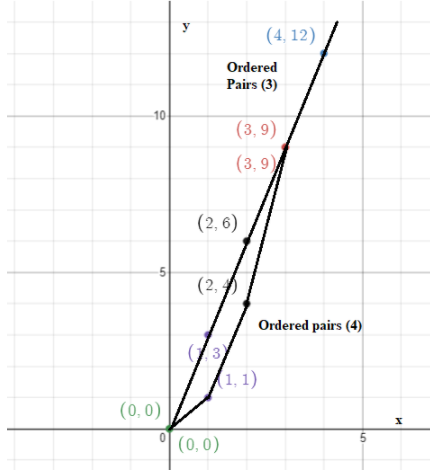
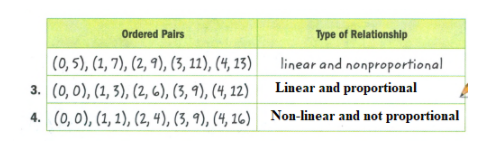
We need to describe the type of relationship shown by each set of ordered pairs.
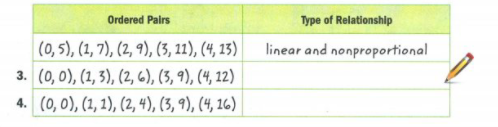
Mark the order part on the given graph
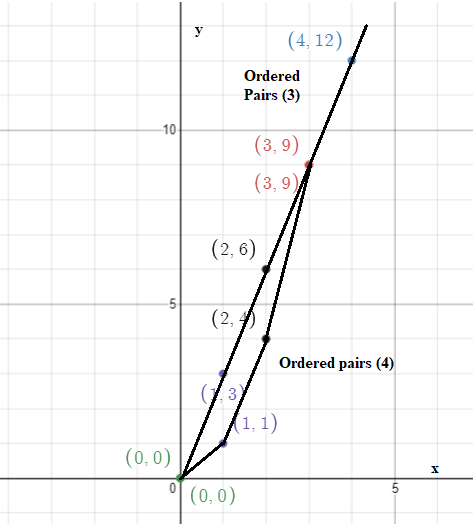
Here, we can see that the ordered pair 3 is a straight line and it passes through the origin.
Thus, it is linear and proportional.
The ordered pair 4 is not a straight line.
Thus, it is neither linear nor proportional.
Page 54 Exercise 4 Problem 22
We need to describe the type of relationship shown by each set of ordered pairs.
Mark the ordered pairs given on the graph
Here, we can see that the ordered pair 3 is a straight line and it passes through the origin.
Thus, it is linear and proportional.
The ordered pair 4 is not a straight line.
Thus, it is neither linear nor proportional.
Glencoe Math Course 2 Volume 1 Common Core Chapter 1 Page 54 Exercise 5 Problem 23
We need to describe a real-world situation that represents a proportional relationship.
Then explain how we could change the situation so that it represents a nonproportional relationship.
Let the real-world situation be, James earns $5 an hour babysitting.
We need to determine whether the amount of money James earns babysitting is proportional to the number of hours he babysits by graphing on the coordinate plane.
Make a table to find the amount of money he earned for 1,2,3,4 and 5 hours
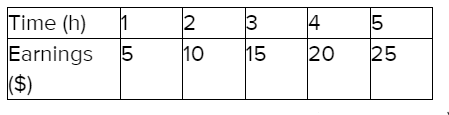
Now, graph the ordered pairs (time, earnings) on the coordinate plane. Then, connect the points together.
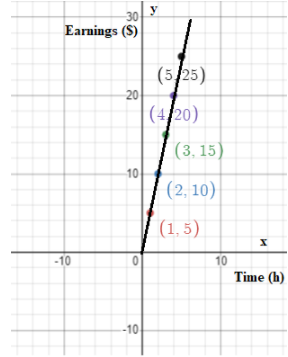
The line passes through the origin and it is a straight line.
Therefore, the amount of money James earns while babysitting is proportional to the number of hours he babysits.
We can change the situation so that it represents a nonproportional relationship by changing the amount of money he earns per hour.
For example, if he gets $5 for the first hour, and $7 for the next consecutive hours.
Then the graph will not be linear. Thus, it exhibits a nonproportional relationship.
The amount of money James earns babysitting is proportional to the number of hours he babysits. We can change the situation so that it represents a nonproportional relationship by changing the amount of money he earns every hour.