
HMH Middle School Grade 7 Practice Fluency Workbook 1st Edition Chapter 4 Ratios and Proportionality
HMH Grade 7 Ratios and Proportionality Exercise 4.2 solutions Page 29 Problem 1 Answer
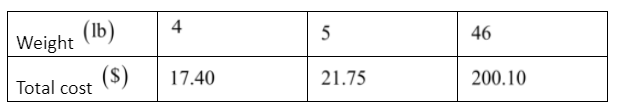
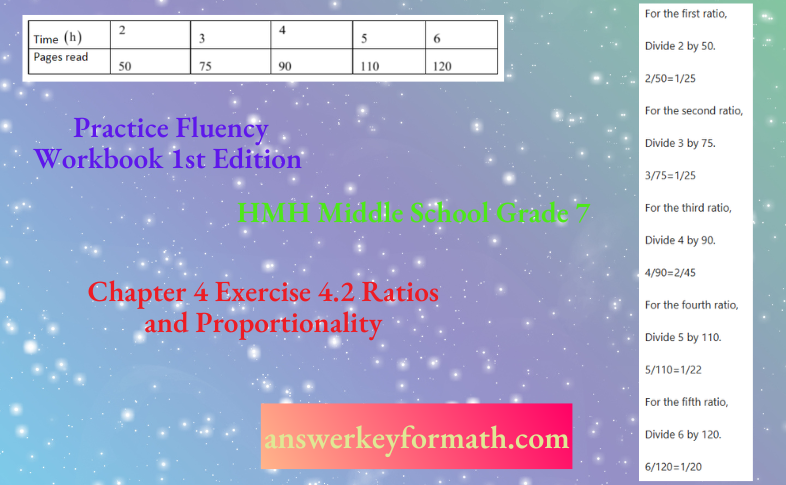
It is given, a table
It is required to write whether the relationship in the given table is proportional or not.
In order to write whether the relationship in the given table is proportional or not, apply the definition of proportion.
In order to check whether the relationship in the given table is proportional or not, evaluate the ratios and check whether they are equal or not.
For the first ratio,
Divide 4 by 17.40.
4/17.40=20/87
For the second ratio,
Divide 5 by 21.75.
5/21.75=20/87
For the third ratio,
Divide 46 by 200.10.
46/200.10=20/87
Since, the ratios are constant, then, the relationship in the given table is proportional.
The relationship in the given table is proportional.
Read and Learn More HMH Middle School Grade 7 Practice Fluency Workbook 1st Edition Solutions
HMH Middle School Grade 7 Chapter 4 Page 29 Problem 2 Answer
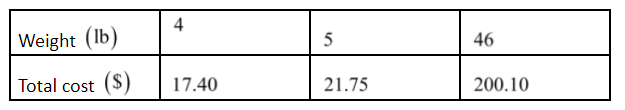
It is given, a table with proportional relationship (refer to a part of this problem)
It is required to write the equation for the given relationship.
In order to write the equation for the given relationship, form the equation using equation of directly proportional relationship.
To begin with, let x be the weight and y be the total cost.
Since, it is a proportional relationship.
So, the equation is in the form y=kx, where k is the constant of proportionality.
Further, evaluate k, by evaluating the difference of any two consecutive value from the table.
Thus, the cost difference of weights for 5th from 4th value is 21.75−17.40=4.35.
Furthermore, verify it by evaluating cost difference between weights 46 and 5.
200.10−21.75/46−5=178.35/41
=4.35
Hence, as evaluated, the equation is y=4.35x.
The equation for the given relationship is y=4.35x.
HMH Middle School Grade 7 Chapter 4 Page 29 Problem 3 Answer
It is given, the equation representing the relationship given in the table is y=4.35x (refer to b part of this problem), and a table
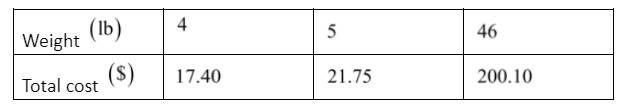
It is required to write the variable to represent weight in the given table.
In order to write the variable to represent weight in the given table, represent weight with any variable.
In order to represent weight with any variable, write which variable represents weight in the given equation y=4.35x.
Thus, the variable x represents the weight.
The variable x represents the weight.
HMH Middle School Grade 7 Chapter 4 Page 29 Problem 4 Answer
It is given, the equation representing the relationship given in the table is y=4.35x (refer to b part of this problem), and a table
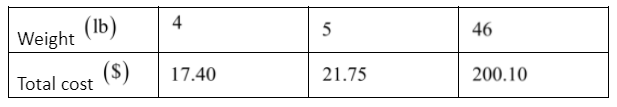
It is required to write the variable to represent total cost in the given table.
In order to write the variable to represent total cost in the given table, represent total cost with any variable.
In order to represent total cost with any variable, write which variable represents total cost in the given equation y=4.35x.
Thus, the variable y represents the total cost.
The variable y represents the total cost.
HMH Middle School Grade 7 Chapter 4 Page 29 Problem 5 Answer
A table as shown below is given.
It is required to check whether the given relationship is proportional or not, if so then write the equation for the relationship.
In order to check whether the given relationship is proportional or not, apply definition of proportional.
In order to check whether the relationship in the given table is proportional or not, evaluate the ratios and check whether they are equal or not.
Since, the ratios are not constant, then, the relationship in the given table is not proportional.
The relationship in the given table is not proportional.
HMH Middle School Grade 7 Chapter 4 Page 29 Problem 6 Answer
A table that shows proportional relationships between two quantities, pens and boxes, is given.
It is required to find the constant of proportionality, k , write an equation to represent the relationship between the two quantities and tell what each variable represents.
First, find whether the two quantities in the table are directly proportional or inversely proportional.
Then, form equation with constant of proportionality k.
Find the value of constant of proportionality.
Finally, substitute the value of k to form the equation that represents the relation between two quantities.
Find the constant of proportionality k.
The table shows the proportionality relationship between two quantities, pens and boxes.
In the table,
Pens=3
Boxes =1
Here, the number of pens is more than the number of boxes. So, the number of pens vary inversely with the boxes.
Let x represent the number of pens and y represent the number of boxes.
For inverse proportion, the equation is,
y=k/x
Where, k is the constant of proportionality.
Solve the equation to represent a relation.
Here,x represents the number of pens and y represents number of the boxes.
So, the value of x is 3 and value of y is 1.
Substitute 3 for x and 1 for y in the equation y=k/x.
1=k/3
Cross multiply.
k=3
The value of k is 3.
To represent the relation in an equation,
Substitute 3 for k.
y=3/x
Hence, y=3/x is the equation that represents the relation.
The value of constant of proportionality k is 3.
The equation that represents the relation between two quantities is y=3/x.
Practice Fluency Workbook Chapter 4 Exercise 4.2 Answers Page 29 Problem 7 Answer
A table that shows proportional relationships between two quantities, pack and muffins, is given.
It is required to find the constant of proportionality,k, write an equation to represent the relationship between the two quantities and tell what each variable represents.
First, find whether the two quantities in the table are directly proportional or inversely proportional. Then, form equation with constant of proportionality k.
Find the value of constant of proportionality.
Finally, substitute the value of k to form the equation that represents the relation between two quantities.
Find the constant of proportionality k.
The table shows the proportionality relationship between two quantities, pack and muffins.
In the table,
Pack =1
Muffins =6
Here, the number of packs is less than the number of muffins. So, the number of packs varies directly with the muffins.
Let x represent the number of packs and y represent the number of muffins.
For directly proportional, the equation is,
y=kx
Where,k is the constant of proportionality.
Solve the equation to represent a relation.
Here, x represents the number of packs and y represents number of the muffins.
Substitute 1 for x and 6 for y in the equation y=kx.
6=k⋅1 Or,k=6
The value of k is 6.
To represent the relation in an equation,
Substitute 6 for k.
y=6k
Hence, y=6k is the equation that represents the relation.
The value of constant of proportionality k is 6.
The equation that represents the relation between two quantities is y=6k.
HMH Middle School Grade 7 Chapter 4 Page 29 Problem 8 Answer
It is given that the number of days is related to the number of hours.
It is required to create table to show how the number of days is related to the number of hours.
Draw a table that represents two quantities, days and hours.
Table represents two quantities days and hours.
The number of days can be related to number of hours, since 1 day has 24 hours.
So,2 days have 48 hours, 3 days have 72 hours, 4 days have 96 hours and 5 days have 120 hours.
Table representation of days and hours is as follows.
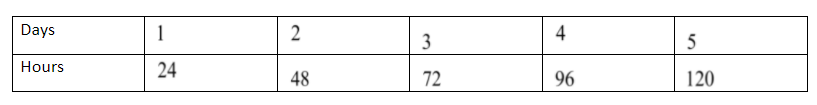
Table that shows a relationship between days and hours is given as,
Page 29 Problem 9 Answer
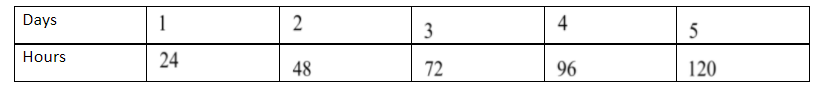
A table that shows the number of days and number of hours is given.
It is required to find if the relationship is proportional.
Find the ratio between the hours and days.
If the rate comes out to be the same, the relationship is proportional.
Given, the table that shows number of days and number of hours
To known if this relationship is proportional, find out the rate of change is constant.
Express each rate of change shown in the table as a fraction.
So, 24/1=24
48/2=24
72/2=24
96/2=24
And, 120/2=24
The rate of change for each column is the same. Because the rate of change is constant, the relationship is proportional.
The relationship is proportional.
HMH Middle School Grade 7 Chapter 4 Page 29 Problem 10 Answer
It is given that the number of days is related to the number of hours.
It is required to find the equation to represent the relationship.
Find the value of constant of proportionality, k.
Then, substitute the value of k in the equation to form the equation that represents the relation between two quantities.
Here, the number of days varies directly with the hours.
Let x represent the number of days and y represent the number of hours.
For directly proportional, the equation is,
y=kx
Where, k is the constant of proportionality.
Substitute 1 for x and 24 for y in the equation y=kx.
24=k⋅1 Or, k=24
The value of k is 24.
Represent the relation in an equation.
Substitute 24 for k.
y=24k
Hence, y=24k is the equation that represents the relation.
The equation that represents the relation between the two given quantities is y=24k.
7th Grade HMH Ratios And Proportionality Exercise 4.2 Step-By-Step Page 30 Problem 12 Answer
A table showing the number of texts that Terri received in a certain period of time is given.
An equation for the relationship is required.
As the proportionality constant is obtained as 3, the equation relating the number of texts y and time period x can be written in terms of the proportionality constant k.
When considering the relation between any two quantities, if the rate of change of one quantity with respect to other remains constant, then, such relationship is proportional.
Write the general equation for a proportional relation of y with respect to x in terms of the proportionality constant k.
y=kx
Rewrite in terms of the proportionality constant 3.
y=3x
The relationship can be expressed in the form of an equation as y=3x.
HMH Middle School Grade 7 Chapter 4 Page 30 Problem 13 Answer
A table showing the number of texts that Terri received in a certain period of time is given.
It is required to find the rate of change from the given relation.
Note that the fraction for each column of the table gives the corresponding rate of change of quantities with respect to other.
But, as the relation in the table is proportional, the rate of change remains constant throughout for each value.
First, write the fraction for each column by dividing the number of texts with time as 3
1,6/2,9/3, and 12/4.As the result of all the four fraction is 3 , the rate of change is also 3.
The result of all the four fraction is obtained as 3 , which means that the rate of change is also 3.
Ratios Grade 7 Practice Fluency Workbook Help Exercise 4.2 Page 30 Problem 14 Answer
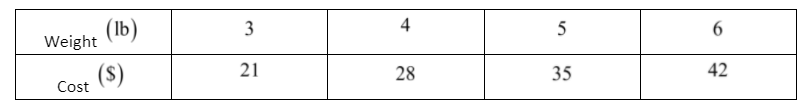
A table is given as shown below where x is the weight.
It is required to write the equation for the given table.
To write the equation for the given table, it is necessary to check the constant rate of change of each set of data from the given table.
Here, x represents the weight and y represents the cost.
Let k be the constant rate of change between x and y.
The constant rate of change is given by, k=y/x.
For the first set of set of data, the constant rate of change k is given by,
21/3=7.
For the second set of set of data, the constant rate of change k is given by,
28/4=7.
For the third set of set of data, the constant rate of change k is given by,
35/5=7.
For the last set of set of data, the constant rate of change k is given by,
42/6=7.
The rate of change for each column is the same. It can be concluded that the rate of change is constant. It implies that the relationship is proportional.
The proportional relationship is scripted as y=kx.
Here, the value of k is 7 for the given relationship.
Hence, the proportional relationship will be y=7x.
The equation for the given table is y=7x.