
Pre-Calculus 11 Student Edition Chapter 3 Quadratic Functions
McGraw Hill Pre Calculus 11 Chapter 2 Exercise 2.4 Solutions Page 143 Problem 1 Answer
Quadratic function are of the form f(x)=ax2+bx+c
OR f(x)=(a−h)2+k,a≠0.
Form own function by substituting several values of parameter a in the function f(x)=ax2
Given quadratic function is f(x)=ax2.
Mcgraw Hill Precalculus Textbook Answers
Substitute the any values of a, we get several function and they are
f(x)=3x2,a=3
f(x)=3/2
x2,a=3/2
f(x)=10x2,a=10
f(x)=5x2,a=5
f(x)=1/5x2,a=1/5
f(x)=4x2,a=4
f(x)=−3x2,a=−3
f(x)=−3/2x2,a=−3/2
f(x)=−10x2,a=10
f(x)=−5x2,a=−5
f(x)=−1/5x2,a=−1/5
f(x)=−4x2,a=−4
own function of the form f(x)=ax2 are
f(x)=3x2
f(x)=3/2x2
f(x)=10x2
f(x)=5x2
f(x)=1/5x2
f(x)=4x2
f(x)=−3x2
f(x)=−3/2x2
f(x)=−10x2
f(x)=−5x2
f(x)=−1/5x2
f(x)=−4x2
Read and Learn More Precalculus Textbook Mcgraw Hill Answers
McGraw Hill Pre Calculus 11 Chapter 2 Exercise 2.4 Solutions Page 143 Problem 2 Answer
f(x)=3x2
f(x)=3/2x2
f(x)=10x2
f(x)=5x2
f(x)=1/5x2
f(x)=4x2
The following quadratic functions opens down
f(x)=−3x2
f(x)=−3/2x2
f(x)=−10x2
f(x)=−5x2
f(x)=−1/5x2
f(x)=−4x2
Mcgraw Hill Precalculus Textbook Answers
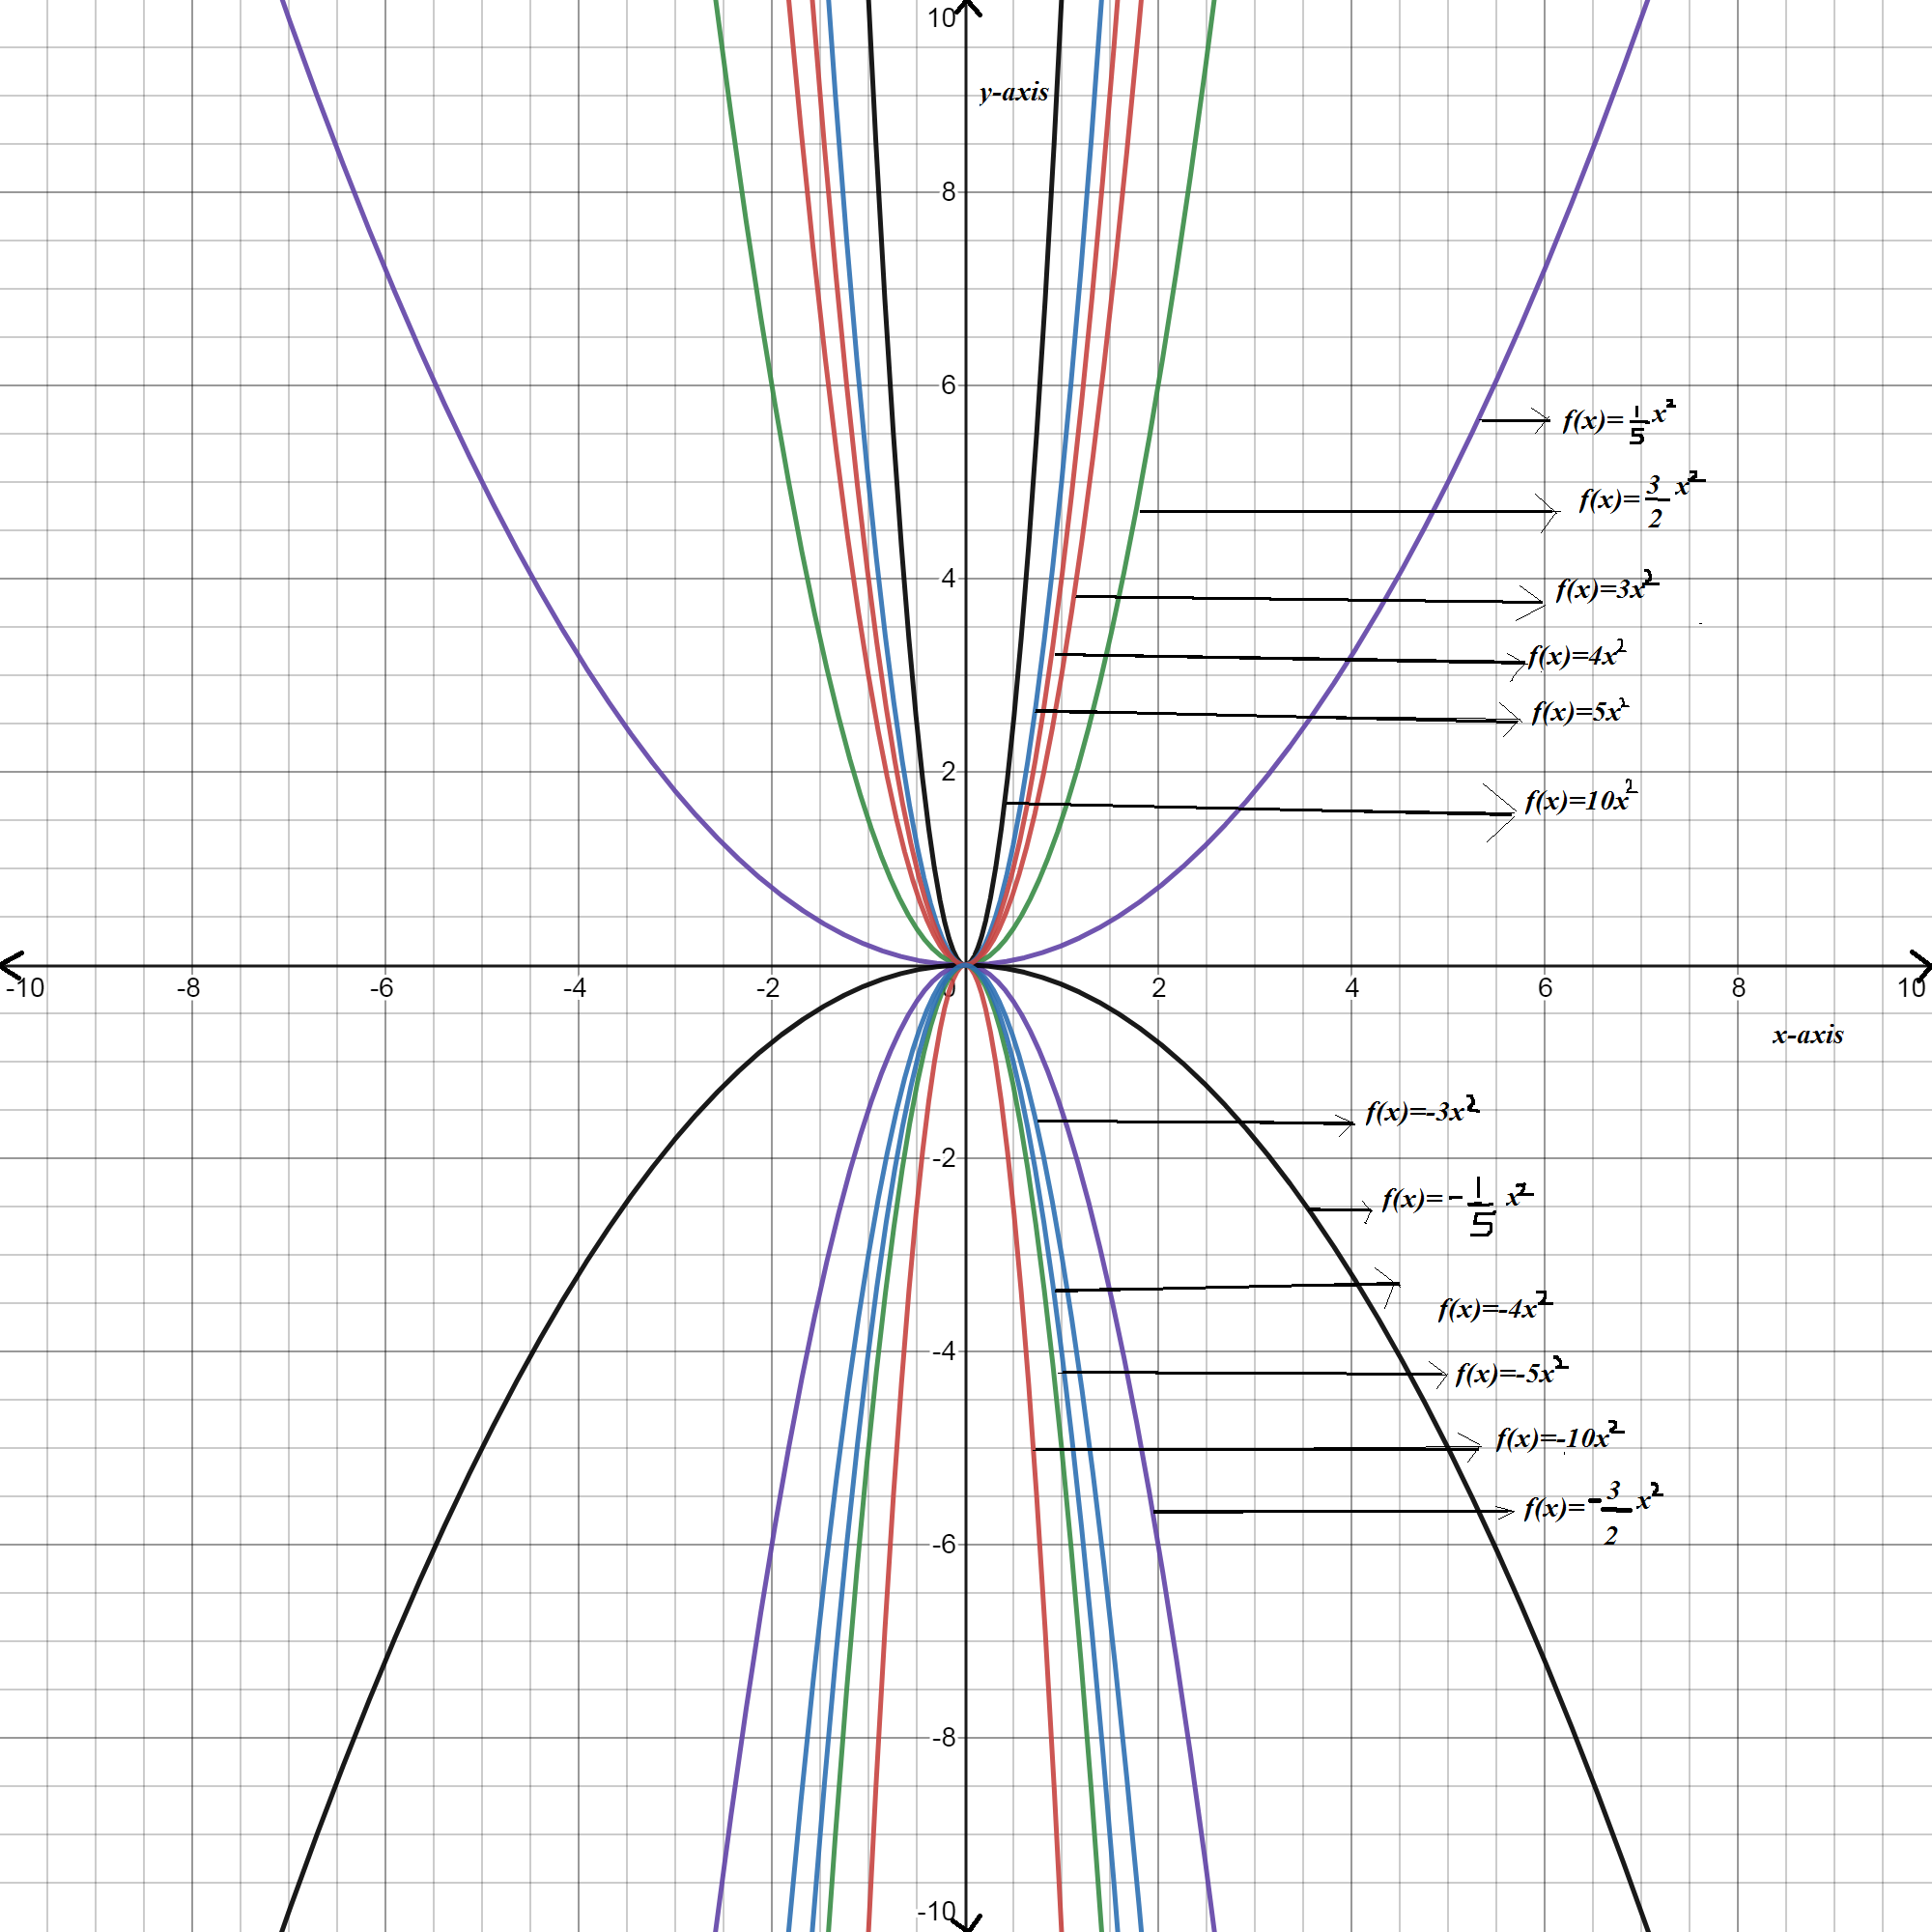
The graph of the above function is shown below

As the value of parameter a increases the curve becomes narrower and when it will be near to 0, curve becomes wider.
In the above graph , the function
f(x)=1/5x2,f(x)=−1/5x2 are wider
f(x)=10x2,f(x)=−10x2 are narrower.
As the value of parameter a increases the curve becomes narrower and when it will be near to 0, curve becomes wider.
In the above graph , the function
f(x)=1/5x2,f(x)=−1/5x2 are wider
f(x)=10x2,f(x)=−10x2 are narrower.
The function f(x)=1/5x2,f(x)=−1/5x2 are wider and the function f(x)=10x2,f(x)=−10x2 are narrower. other function lies in between them
Pre Calculus 11 Chapter 2 Exercise 2.4 Trigonometry Solved Problems Page 143 Problem 3 Answer
The quadratic function is of the form f(x)=ax2+bx+c OR f(x)=a(x−h)2+k,a≠0
If the parameter a is close to 0, the graph opens wider
If the parameter a is farther from 0, the graph opens narrower
If the parameter a>0, the graph opens up
If the parameter a<0, the graph opens down
The Quadratic function is f(x)=ax2
If a>1>0, the graph opens up.
Mcgraw Hill Precalculus Textbook Answers
As the parameter a is close to 1, the graph opens wider and a
is farther to 1, the graph becomes narrower.
The quadratic function f(x)=ax2 with parameter a>1 opens up.
when a is close to 1 , the graph opens wider
when a is farther to 1, the graph becomes narrower
Pre Calculus 11 Chapter 2 Exercise 2.4 Trigonometry Solved Problems Page 143 Problem 4 Answer
We need to find how the value of a in f(x)=ax2 changes the graph of f(x)=x2 when a is a positive number less than 1.
a is a positive number
a>0 no reflection about x-axis.
a is less than 1
a<1, graph is wider.
when a is a positive number less than 1,
Then f(x)=x2 gets wider with value of a goes from 1→0 to form graph of f(x)=ax2
Pre Calculus 11 Chapter 2 Exercise 2.4 Trigonometry Solved Problems Page 143 Problem 5 Answer
We need to find how the value of a in f(x)=ax2 changes the graph of f(x)=x2 when a is a negative number.
is a negative number
a<0 graph reflected about x-axis.
If a<−1, graph gets narrower.
If −1<a<0, graph gets wider.
when a is a negative number, Then f(x)=x2 gets reflected about x-axis to form graph of f(x)=ax2
If a<−1, graph gets narrower.
−1<a<0, graph gets wider.
Precalculus Textbook Mcgraw Hill Answers
Pre Calculus 11 Chapter 2 Exercise 2.4 Trigonometry Solved Problems Page 143 Problem 6 Answer
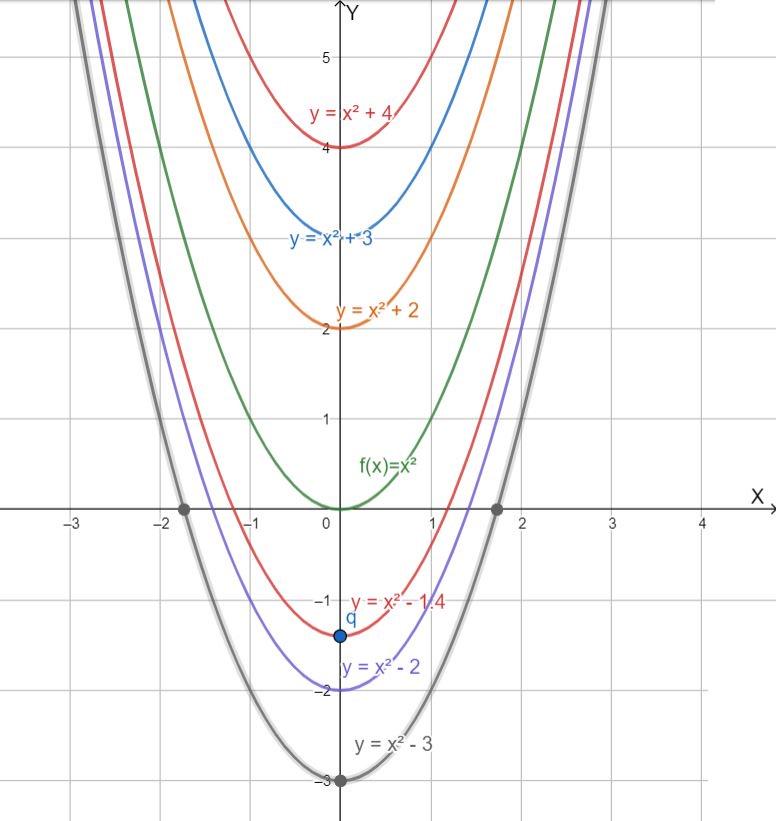
Given : f(x)=x2+q
By substituting q=0,2,3,4,−1.4,2,3
we can obtained the different forms of the function f(x)=x2+q.
q= 0 f(x) = x2
q= 2 f(x) = x2 + 2
q = 3 f(x) = x2 + 3
q = 4 f(x) = x2 + 4
q = −1.4 f(x) = x2 − 1.4
q = −2 f(x) = x2 − 2
q = −3
The different forms of the function are f(x)=x2,f(x)=x2+2,f(x)=x2+3,f(x)=x2+4,f(x)=x2−1.4,f(x)=x2−2,f(x)=x2−3
Pre Calculus 11 Exercise 2.4 Step-By-Step Trigonometry Solutions Page 143 Problem 7 Answer
We have to compare the function f(x)=x2+q with the function f(x)=x2 for different positive and negative values of q.
Use a graphing calculator and draw the graph of the given function for different values of q then compare with the graph of f(x)=x2.
The graph of the function f(x)=x2+q for different values of q and f(x)=x2 is drawn as

When we compare the graph of the function then we can observe that if the q is positive then the graph of f(x)=x2 translates q units upward along the y-axis and if the q is negative then the graph of f(x)=x2 translates q units downward along y-axis.
Pre Calculus 11 Exercise 2.4 Step-By-Step Trigonometry Solutions Page 150 Problem 8 Answer
Given: quadratic functiony=1/2(x−2)2−4
To determine: 1. Vertex
2.The domain and range
3.The direction of opening
4.The equation of the axis of symmetry
Use the values of a,p and q to determine these characteristics and sketch the graph.
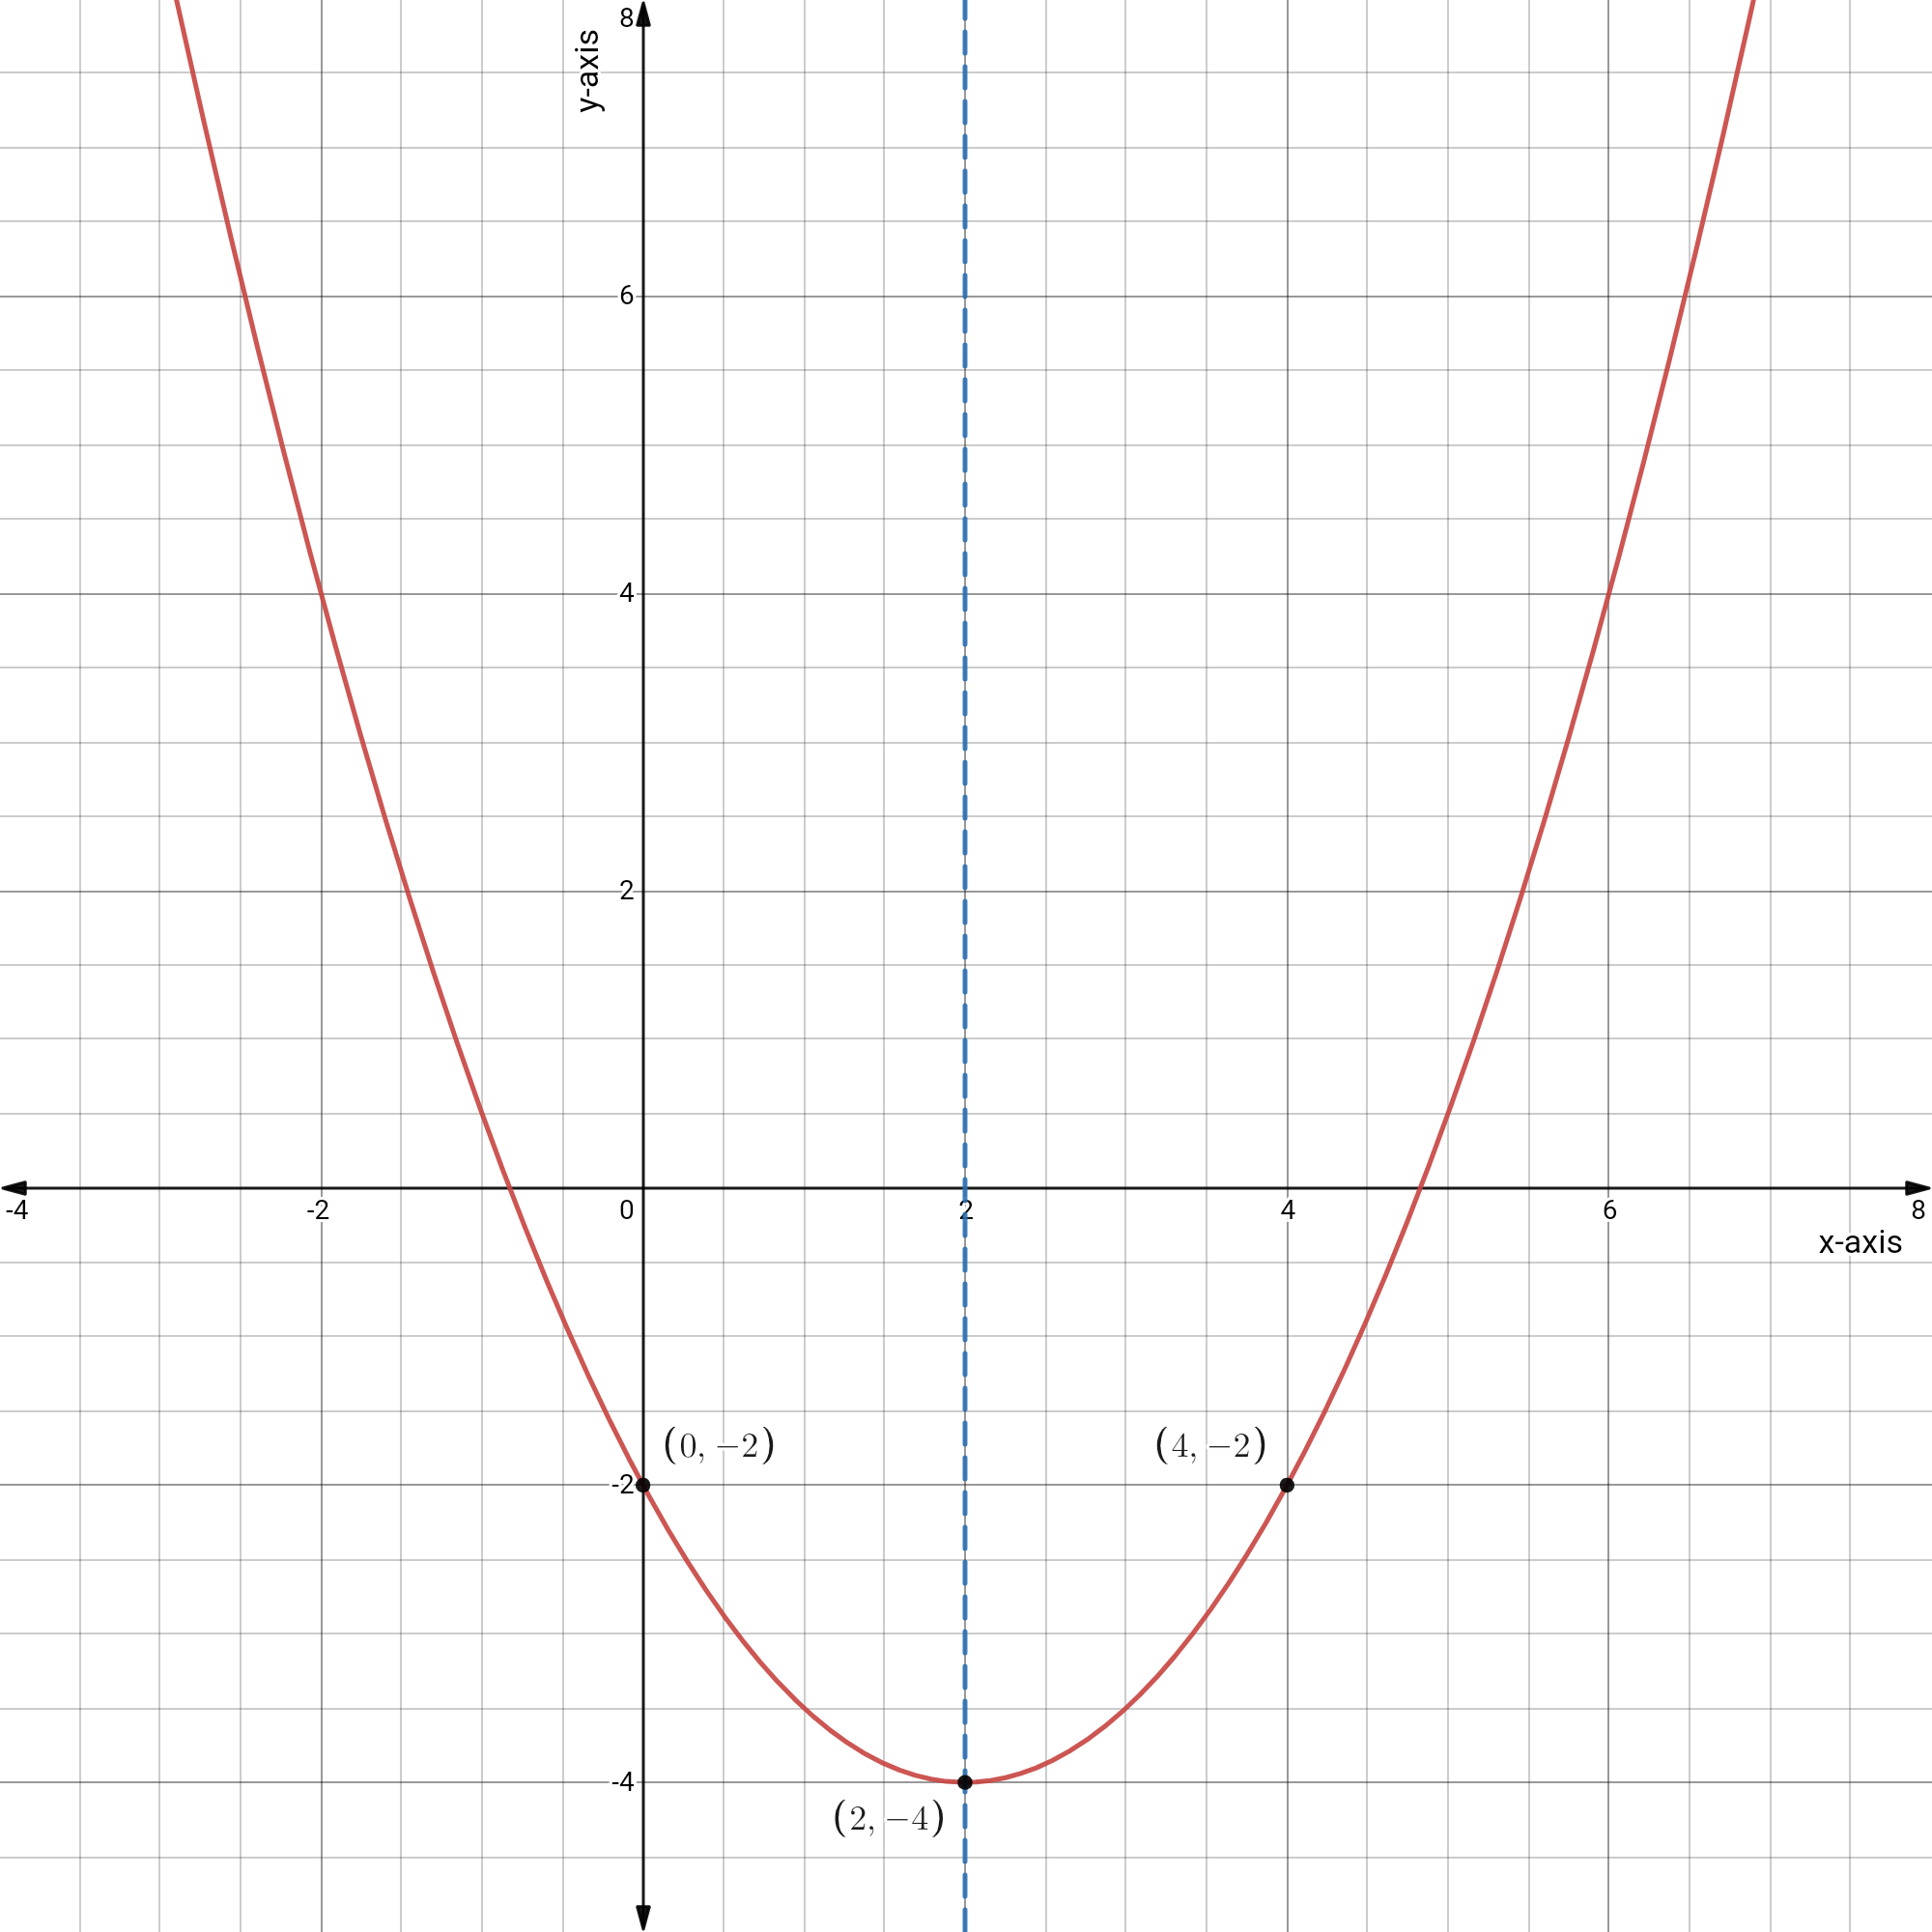
We have the quadratic function y=1/2(x−2)2−4
Compare this function toy=a(x−p)2+q, we get
a=1/2,p=2 and q=−4
Vertex: Since p=2andq=−4, the vertex is located at(2,−4).
The domain and range: Since q=−4, the range is {y∣y≥−4,y∈R}and the domain is {x∣x∈R}.
The direction of opening: Since a>0, the graph opens upward.
The equation of the axis of symmetry: Since p=2, the equation of the axis of symmetry is x−2=0 or x=2.
Plot the coordinates of the vertex,(2,−4), and draw the axis of symmetry,x=2.
Determine the coordinates of one other point on the parabola.
For example, determine y−intercept by substitutingx=0 into the given function.
y=1/2(0−2)2−4
y=1/2(4)−4
y=2−4
y=−2
The point(0,−2) is on the graph.
Precalculus Textbook Mcgraw Hill Answers
For any point other than the vertex, there is a corresponding point that is equidistant from the axis of symmetry.
In this case, the corresponding point of(0,−2) is(4,−2).
Plot this two additional points and complete the sketch of the parabola.
The graph of given function is:
1.Vertex:(2,−4)
2.The domain:{x∣x∈R} and range:{y≥−4∣y∈R}
3.The direction of opening: Upward
4.The equation of the axis of symmetry: x=2
The graph of a function:
Precalculus Textbook Mcgraw Hill Answers
Pre Calculus 11 Exercise 2.4 Step-By-Step Trigonometry Solutions Page 150 Problem 9 Answer
Given: quadratic functiony=−3(x+1)2+3
To determine: 1. Vertex
2.The domain and range
3.The direction of opening
4.The equation of the axis of symmetry
Use the values of a,p and q to determine these characteristics.
We have the quadratic function y=−3(x+1)2+3.
Compare this function toy=a(x−p)2+q, we get a=−3,p=−1 and q=3
Vertex: Since p=−1 and q=3, the vertex is located at(−1,3).
The domain and range: Since q=3, the range is{y∣y≤3,y∈R} and the domain is{x∣x∈R}.
The direction of opening: Sincea<0, the graph open downward.
The equation of the axis of symmetry: Sincep=−1, the equation of the axis of symmetry is x=−1.
Plot the coordinates of the vertex,(−1,3), and draw the axis of symmetry,x=−1.Determine the coordinates of one other point on the parabola.
For example, determine y−intercept by substituting x=0into the given function.
Mcgraw-Hill Textbook Answers
y=−3(x+1)2+3
y=−3(0+1)2+3
y=−3(1)+3
y=0
The point(0,0) is on the graph.
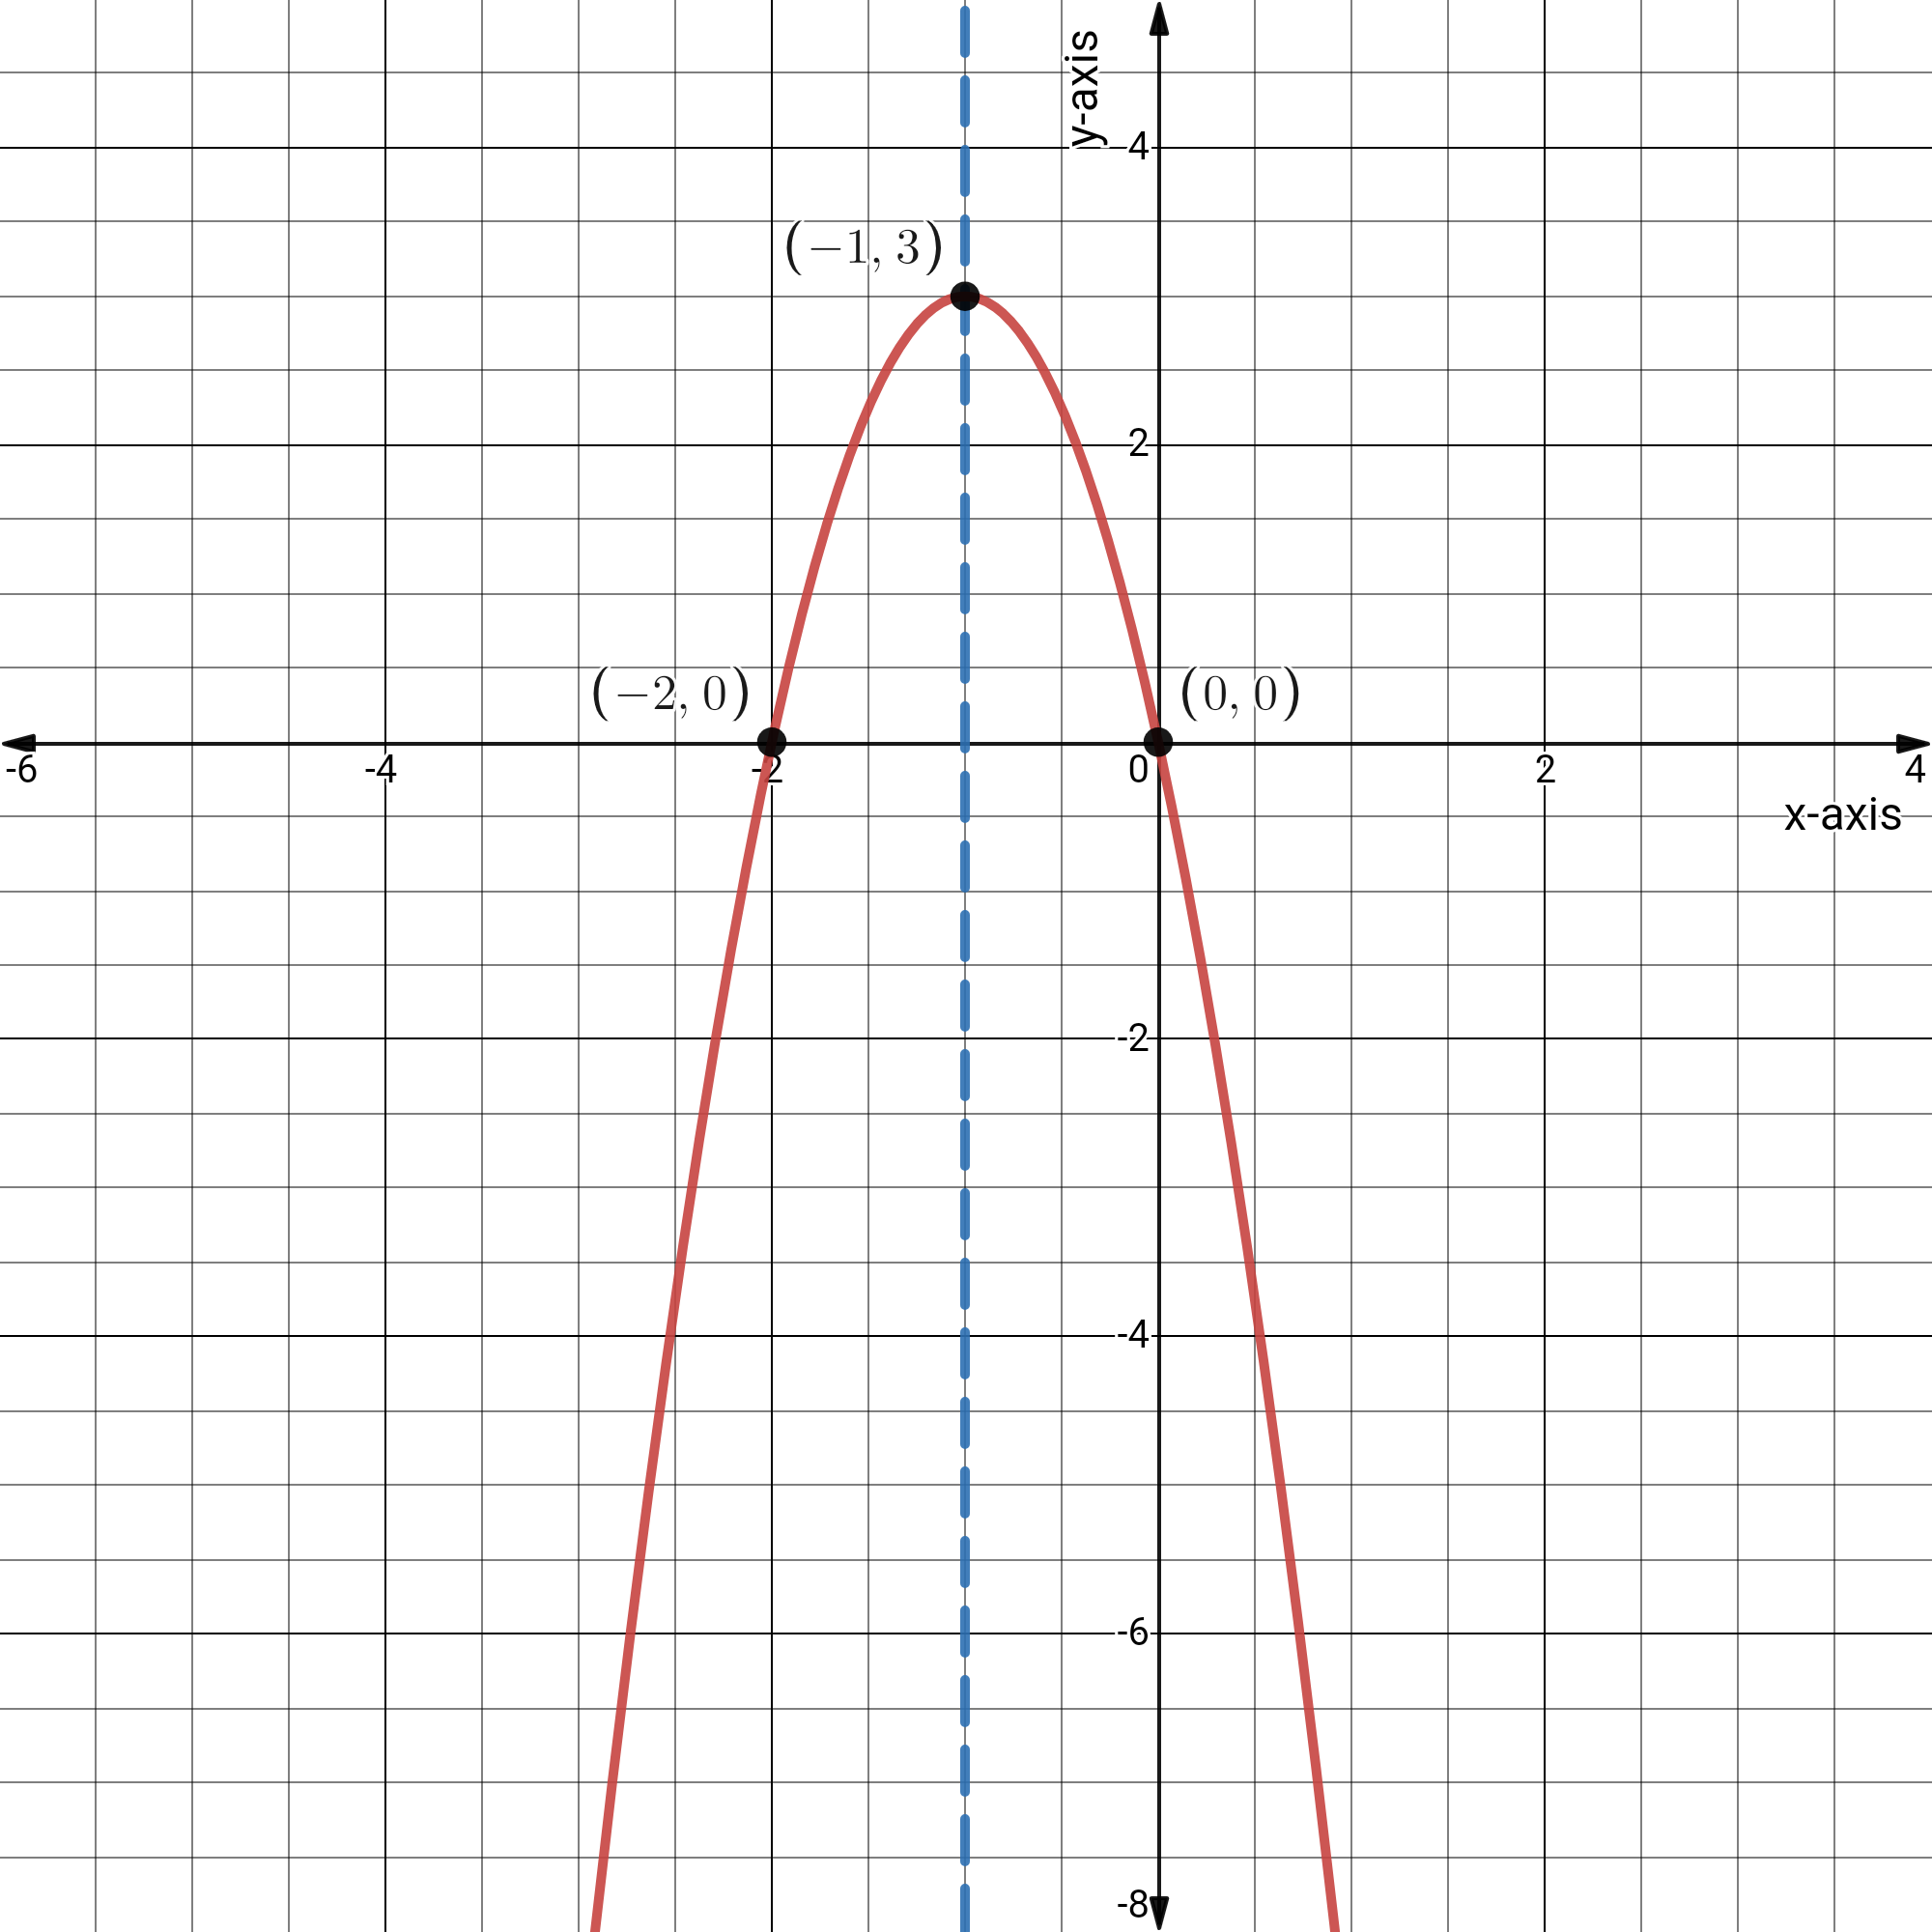
For any point other than the vertex, there is a corresponding point that is equidistant from the axis of symmetry.
In this case, the corresponding point of(0,0) is(−2,0).
Plot this two additional points and complete the sketch of the parabola.
The graph of given function is:
1 Vertex:(−1,3)
2.The domain:{x∣x∈R} and range:{y∣y≤3,y∈R}
3.The direction of opening: Downward
4.The equation of the axis of symmetry:x=−1
The graph of given function is:

Pre Calculus 11 Exercise 2.4 Step-By-Step Trigonometry Solutions Page 153 Problem 10 Answer
There is given a graph of a parabola.
It is asked to determine a quadratic function in vertex form.
The quadratic function can be found by finding the vertex and applying the vertex form of the parabola formula.
Firstly, we can find the vertex from the graph
We know that vertex of any parabola is the point where the graph changes its shape.
The graph is changing shape at (−3,0)
so, the vertex is (h,k)=(−3,0)
Apply vertex form of the parabola formula: y=a(x−h)2+k
Plug vertex point into the formula
Mcgraw-Hill Textbook Answers
y=a(x+3)2+0
Now, we can select anyone point and find a
The point is (−1,−2)
Plug this point into the formula−2=a(−1+3)2+0
22a=−2
4a=−2
a=−1/2
Plug this value into the formula
y=−1/2(x+3)2+0
Hence, the quadratic function is y=−1/2(x+3)2+0
Pre Calculus 11 Exercise 2.4 Step-By-Step Trigonometry Solutions Page 153 Problem 11 Answer
There is given a graph of a parabola.
It is asked to determine a quadratic function in vertex form.
The quadratic function can be found by finding the vertex and applying the vertex form of the parabola formula.
Firstly, we can find the vertex from the graph
We know that vertex of any parabola is the point where the graph changes its shape.
The graph is changing shape at (2,1)
so, the vertex is (2,1)
Apply vertex form of the parabola formula: y=a(x−h)2+k
Plug vertex point into the formula
y=a(x−2)2+1
Now, we can select anyone point and find a
The point is (1,5)
Plug this point into the formula
5=a(1−2)2+1
a+1=5
a=4
Plug this value into the formula
y=4(x−2)2+1
Hence, the quadratic function is f(x)=4(x−2)2+1
Mcgraw-Hill Textbook Answers
Solutions For Pre Calculus 11 Chapter 2 Exercise 2.4 Trigonometry Page 154 Problem 12 Answer
The function is given as
f(x)=0.5x2−7
It is asked to find x-intercepts of this function without graphing
It can be found by replacing f(x) as zero and solve for x
The function is f(x)=0.5x2−7
We can set f(x)=0 and solve for x
f(x)=0.5x2−7=0
0.5x2−7=0
Add both sides by 7
0.5x2=7
Divide both sides by 0.5
0.5x2/0.5=7/0.5
x2=14
Take square root on both sides
x=√14,x=−√14
Hence, x-intercepts are x=√14,x=−√14
Solutions For Pre Calculus 11 Chapter 2 Exercise 2.4 Trigonometry Page 154 Problem 13 Answer
The function is given as f(x)=−2(x+1)2
It is asked to find x−intercepts of this function without graphing
It can be found by replacing f(x) as zero and solve for x
The function is f(x)=−2(x+1)2
We can set f(x)=0 and solve for x
Mcgraw-Hill Textbook Answers
f(x)=−2(x+1)2=0
−2(x+1)2=0
Divide both sides by −2
−2(x+1)2/−2=0/−2
(x+1)2=0
Take square root on both sides x+1=0
x=−1,x=−1
Hence, x-intercepts are x=−1,x=−1
Solutions For Pre Calculus 11 Chapter 2 Exercise 2.4 Trigonometry Page 154 Problem 14 Answer
The function is given as f(x)=−1/6(x−5)2−11
It is asked to find x− intercepts of this function without graphing.
It can be found by replacing f(x) as zero and solve for x
The function is
f(x)=−1/6(x−5)2−11
We can set f(x)=0 and solve for x
f(x)=−1/6(x−5)2−11=0
−1/6(x−5)2−11=0
−1/6(x−5)2−11+11=0+11
−1/6(x−5)2=11
(−1/6(x−5)2)(−6)=11(−6)
(x−5)2=−66
Take square root on both sides
There is a negative value on the right side
And we know that square root of negative is always imaginary values
So, x-intercepts do not exist for this function.
Hence, x-intercepts do not exist for this function.
Solutions For Pre Calculus 11 Chapter 2 Exercise 2.4 Trigonometry Page 157 Problem 15 Answer
Given :- The equation of parabolay=7x2
To find :- The graph of the parabola and whether it has maximum or minimum value and also we have to find range of the function.
First we will plot the graph by comparing the graph of the parabola y=x2.
y=x2has vertex at origin because it is of form y=ax2 hence y=7x2 also has vertex at origin i.e.(0,0).
On comparing given parabola with standard equation we will get7>0 and 7>1 so the parabola will be upward and narrow than y=x2.
The required parabola is shown in graph in red color.
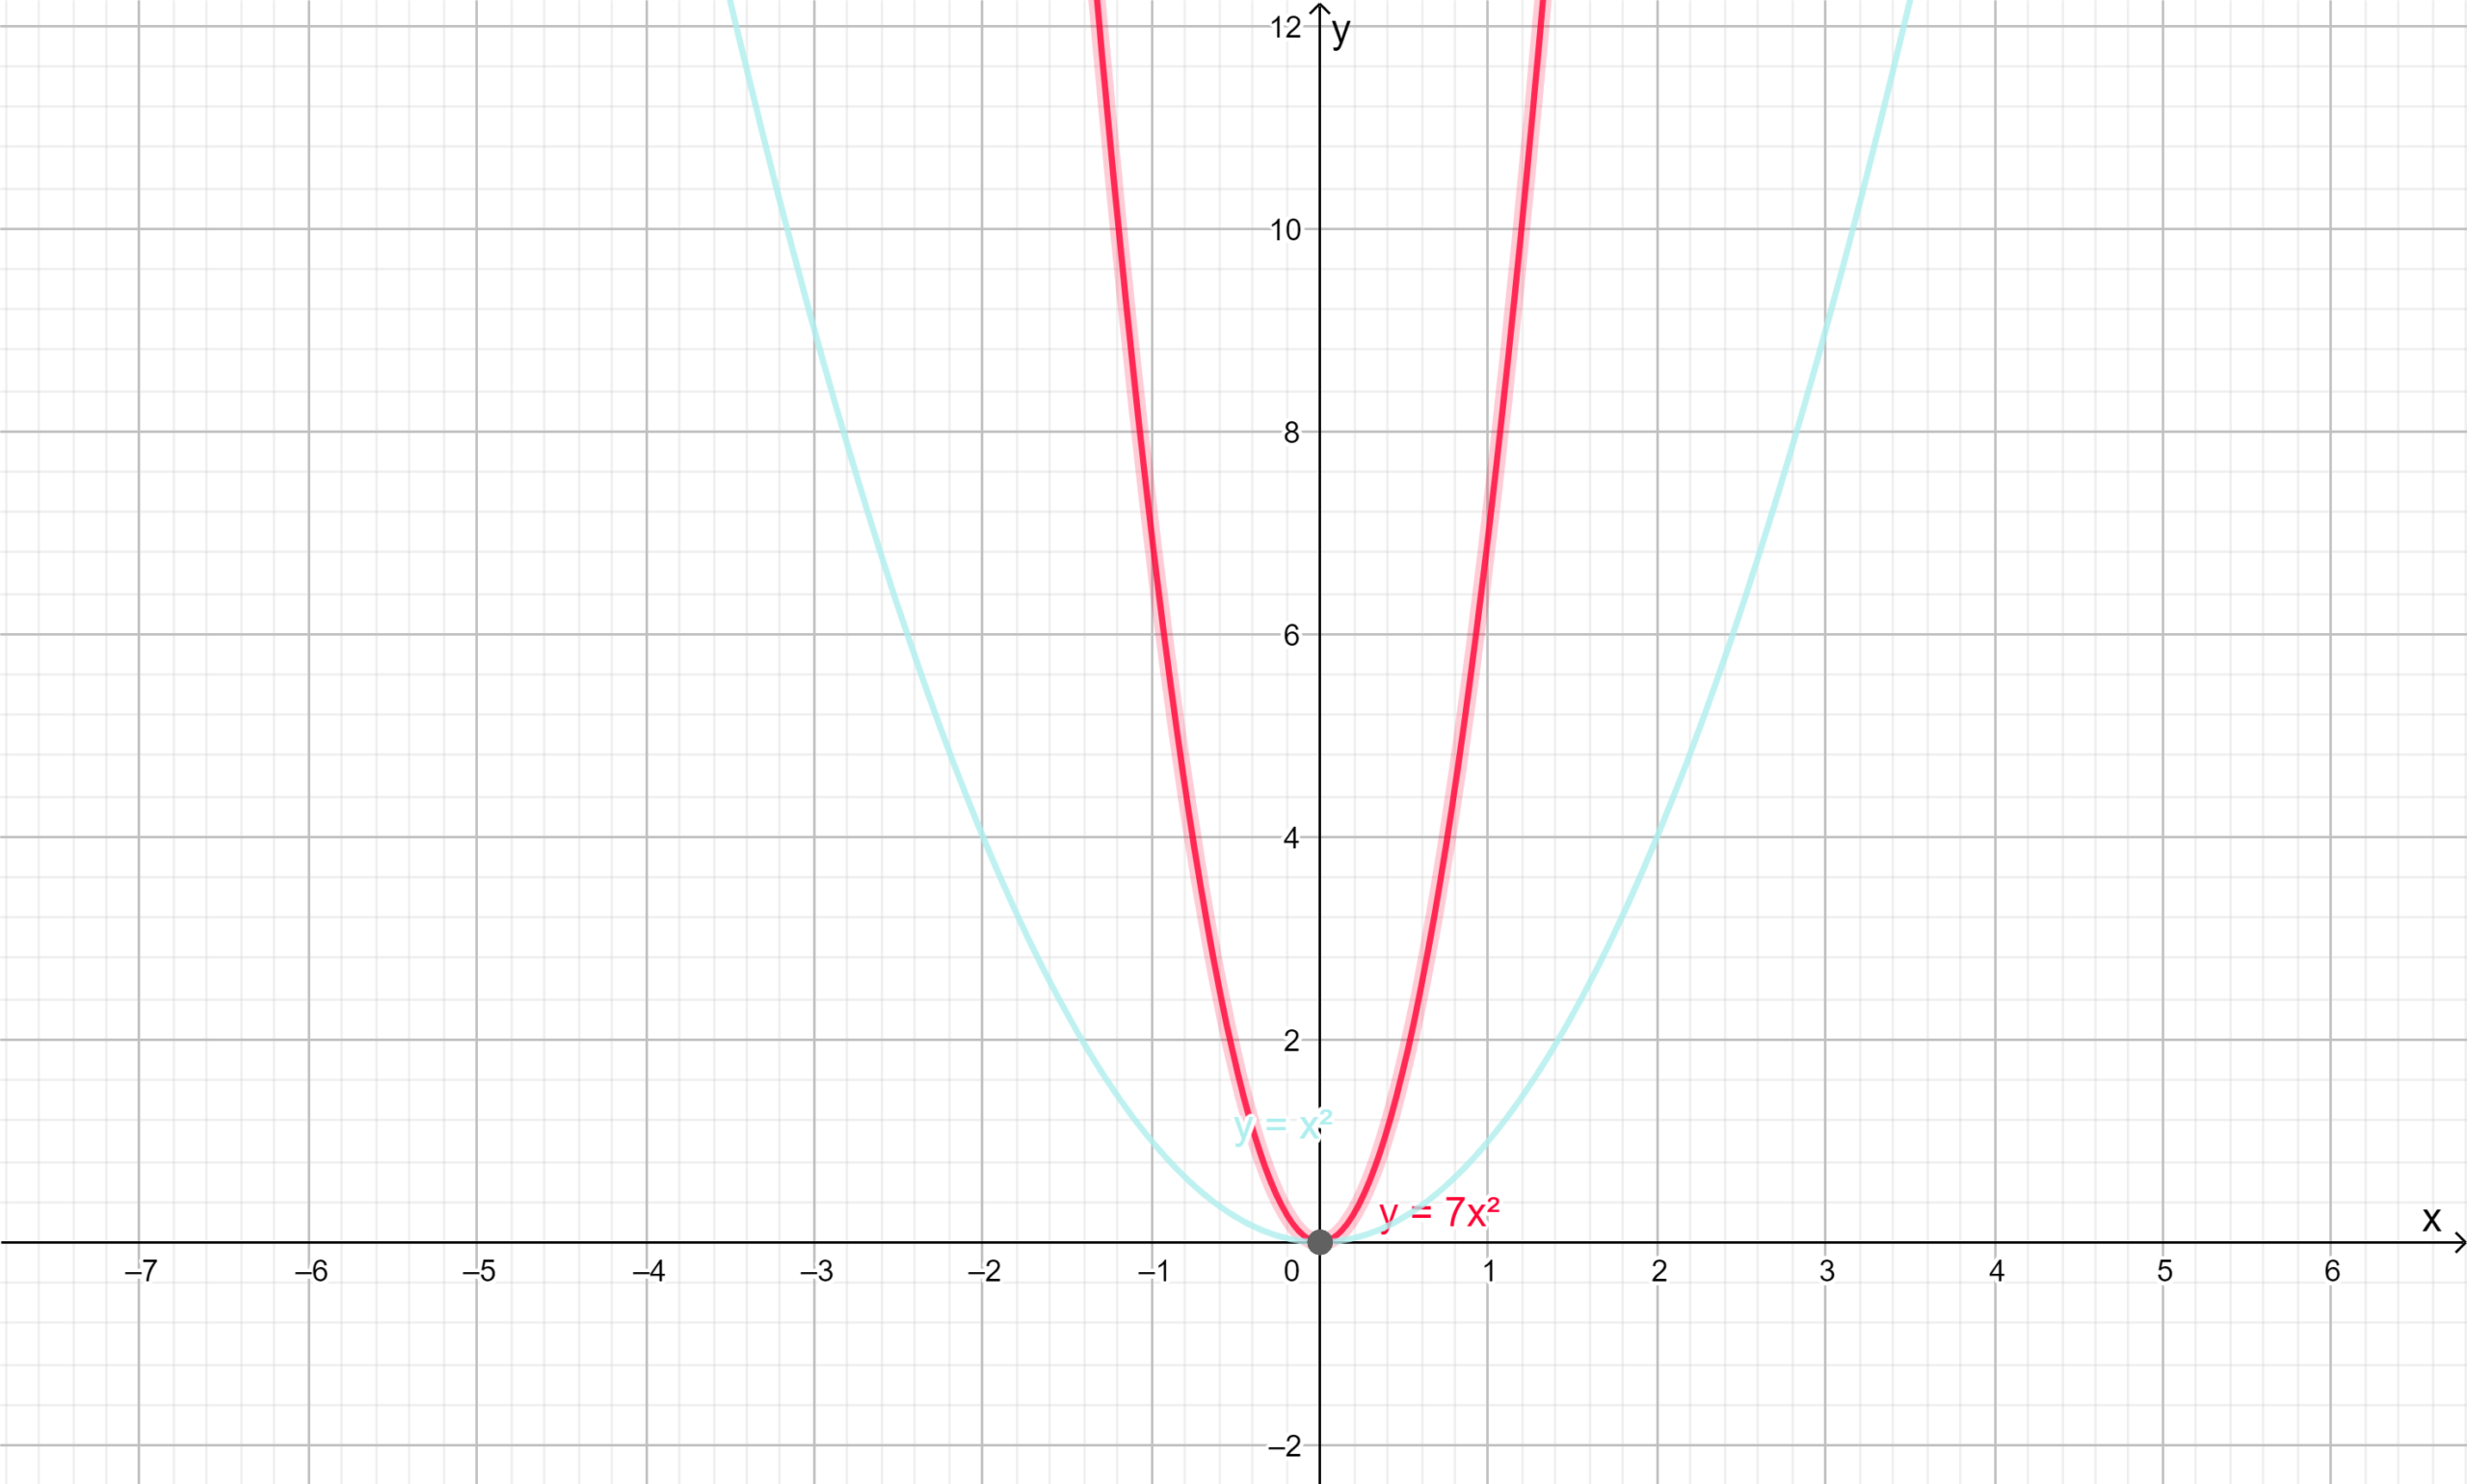
The range of the functiony=7x2 is{y∣y≥0,y∈R}.
To find the maxima or minima we will now differentiatey=7x2w.r.tx.
⇒dy/dx
=14x
⇒d2y/dx2
=14
⇒d2y/dx2>0
This means that function has minimum value.
The range of the parabola y=7x2 is{y∣y≥0,y∈R} and has minimum value.
Pre Calculus 11 Mcgraw Hill Chapter 2.4 Solved Examples Page 157 Problem 16 Answer
Given :-y=1/6x2
To find:- The graph of the parabola and whether it has maximum or minimum value and also we have to find range of the function.
First we will plot the graph by comparing the graph of the parabolay=x2
y=x2 has vertex at origin because it is of form y=ax2 hencey=1/6x2 also has vertex at origin.
On comparing given parabola with standard equation we will get a=1/6>0,1/6<1 therefore the parabola will open upward and wider than y=x2.
Red color curve represent the required parabola.
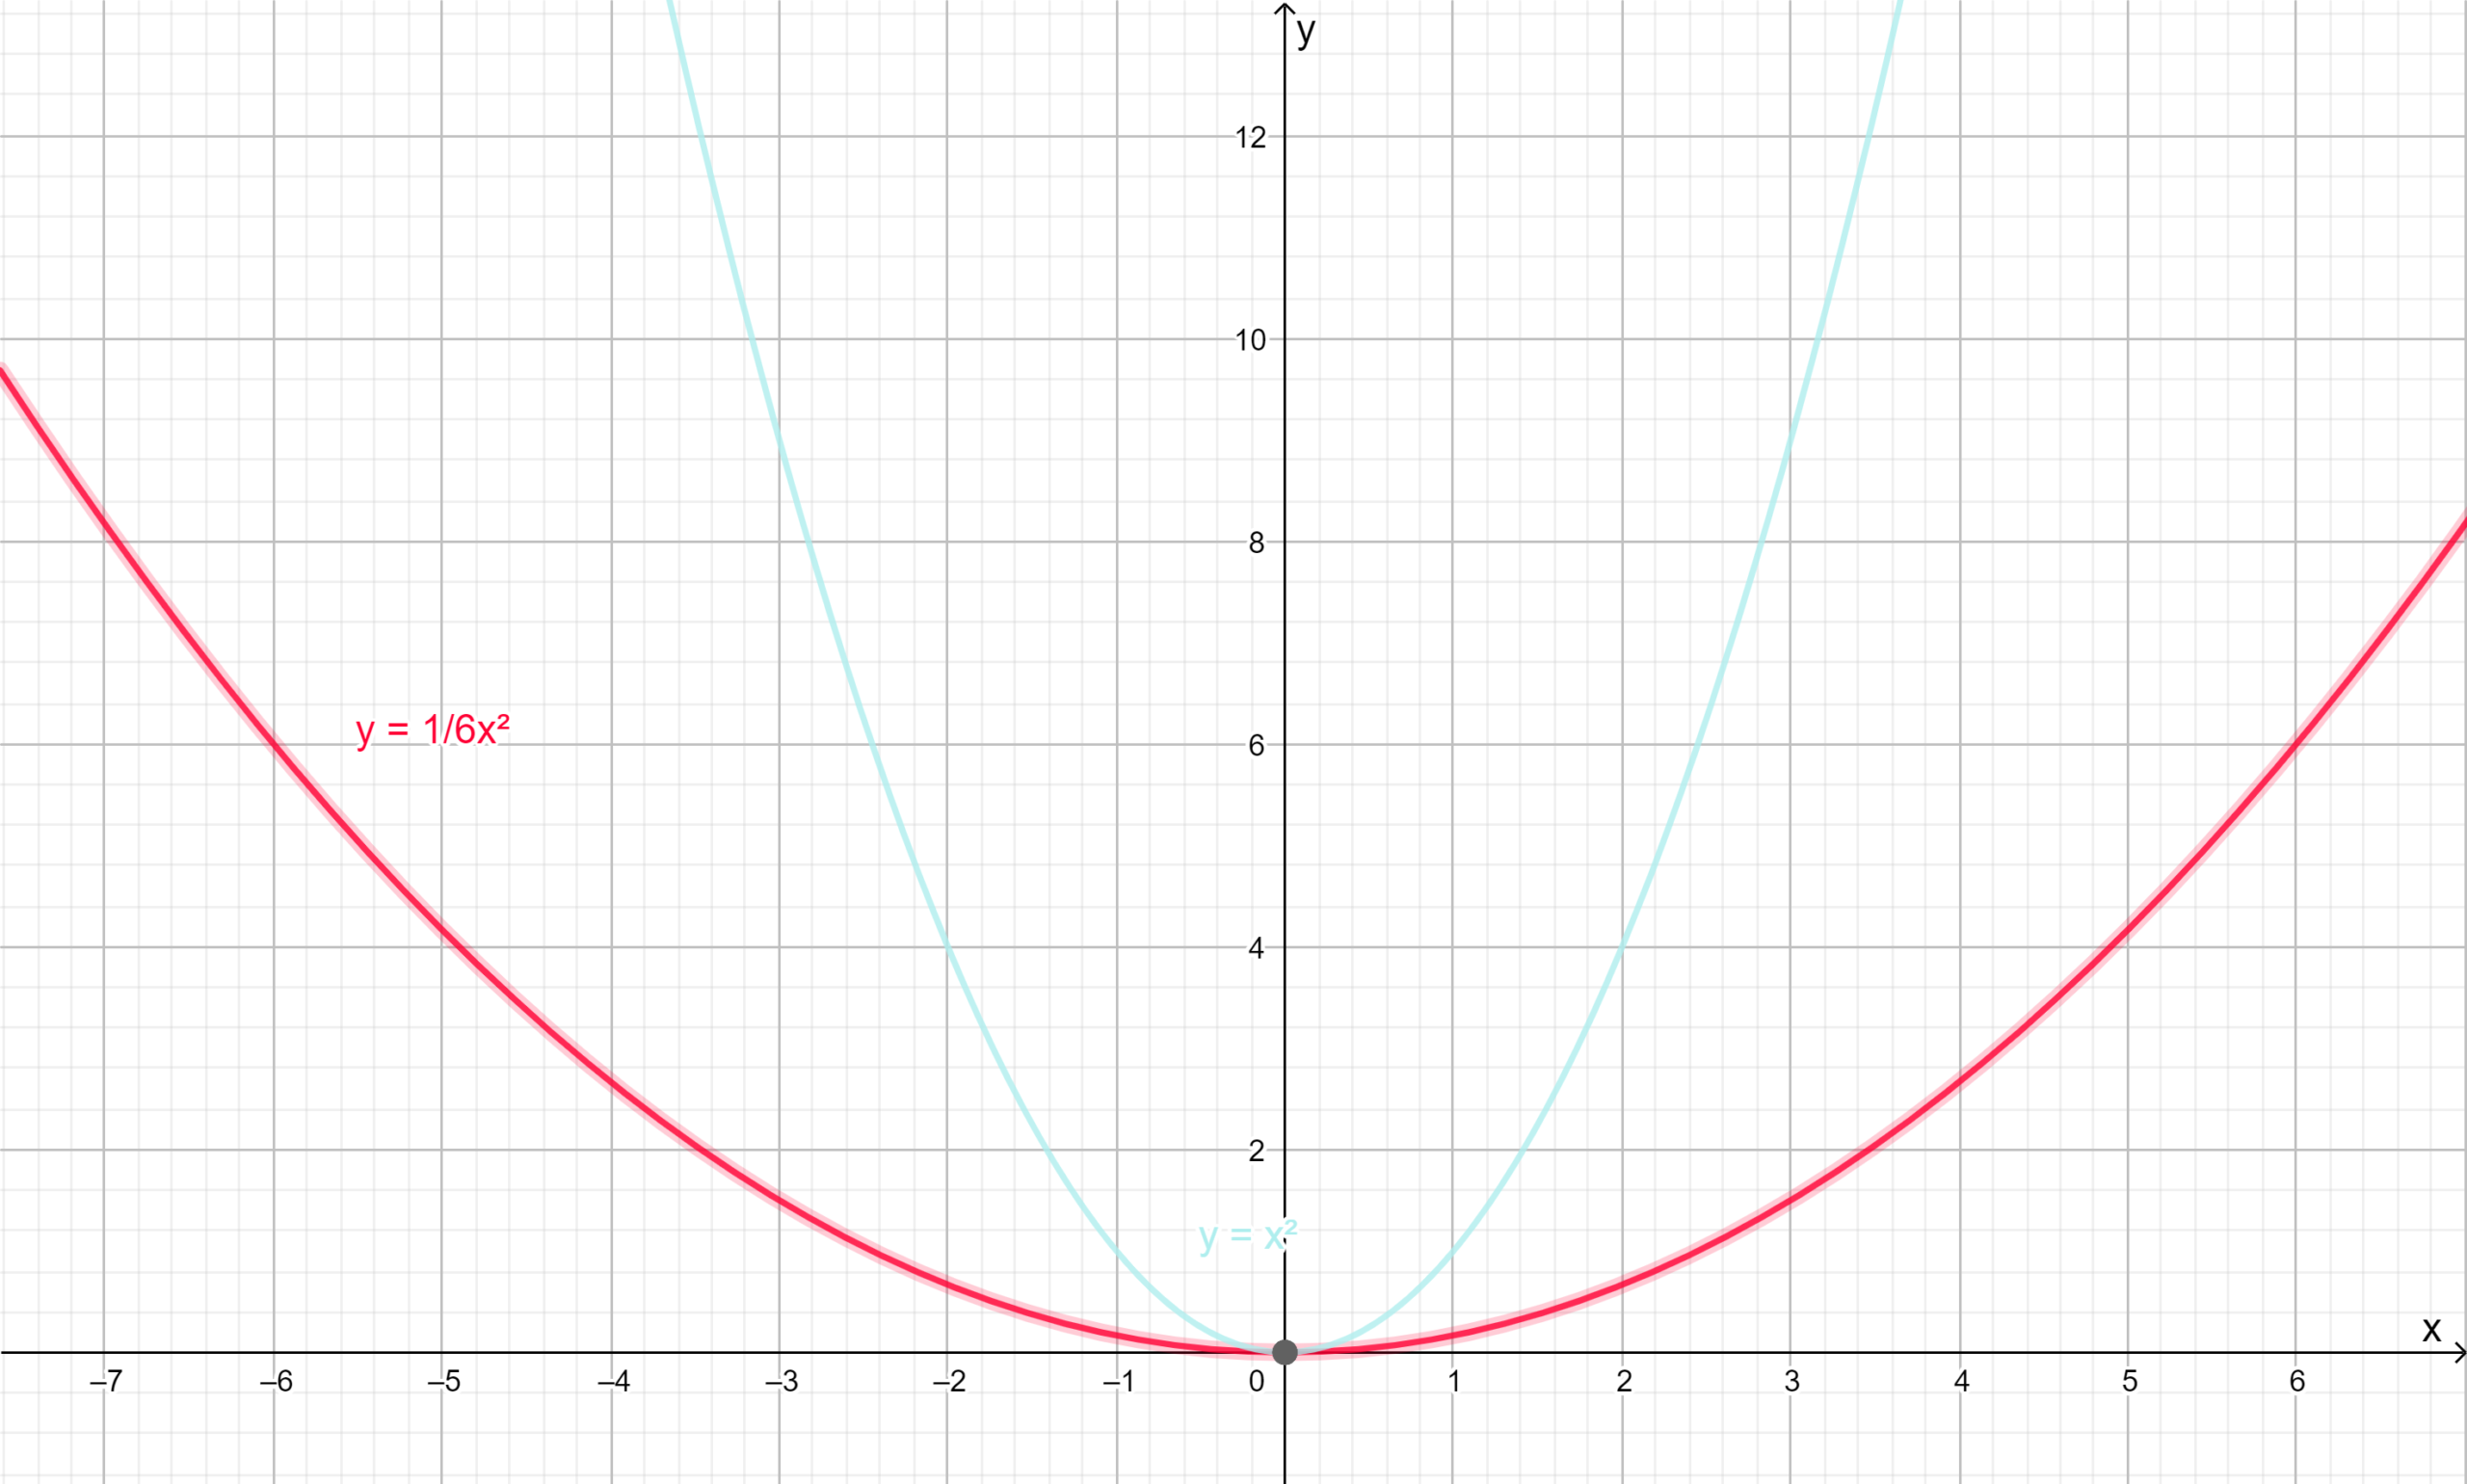
The range of the parabola is{y∣y≥0,y∈R}.
To find whether the function has minimum or maximum value, we will take derivate of the function twice.
⇒dy/dx=1/3x
⇒d2y/dx2=1/3
⇒d2y/dx2>0
Hence function has minimum value.
The range of y=1/6x2 is{y∣y≥0,y∈R} and function has minimum value.
Pre Calculus 11 Mcgraw Hill Chapter 2.4 Solved Examples Page 157 Problem 17 Answer
Given :-y=−4x2
To find :-State the direction of opening, whether it has a maximum or a minimum value, and the range.
First we will plot the graph by comparing the graph of the parabola y=x2.
y=x2 has vertex at origin since it is of form y=ax2 hencey=−4x2 has vertex at origin and narrower than y=x2 sincea=−4<−1 and it will open downward sincea=−4<0.
The graph is shown below in red color.
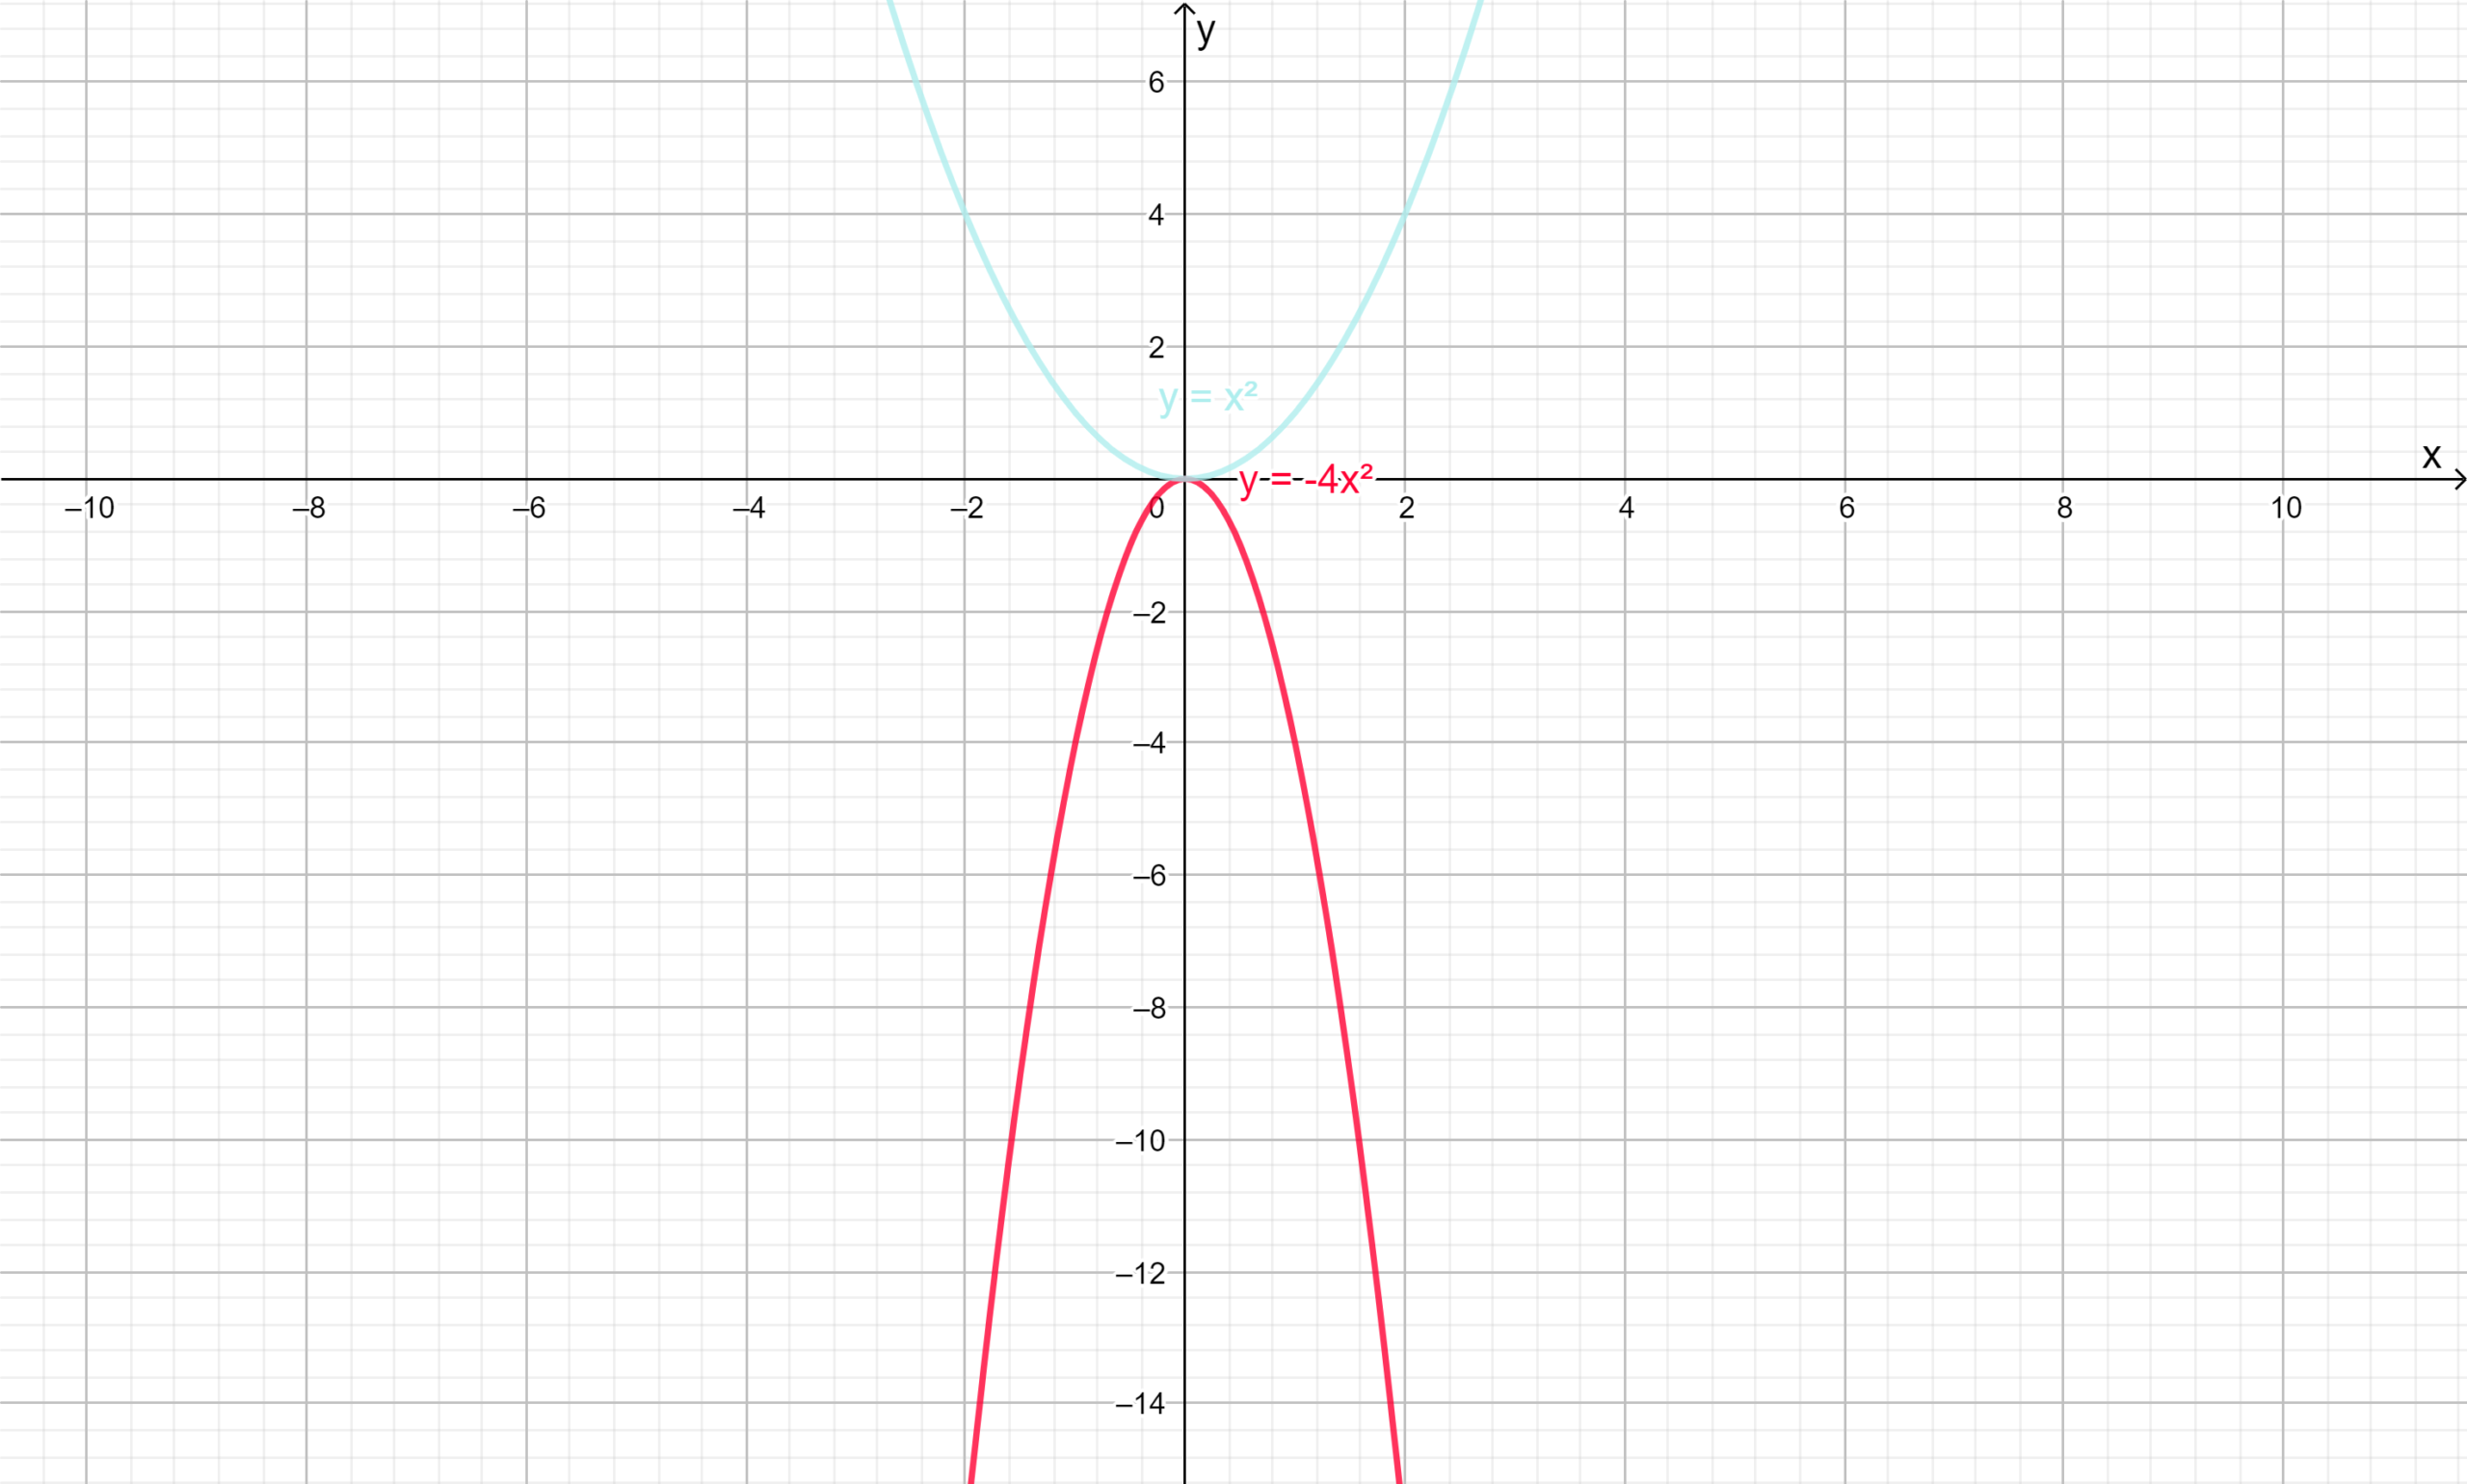
The range of the function isy=−4x2 is{y∣y≤0,y∈R}.
To find whether the function has minimum or maximum value we will take derivate of the function twice.
⇒dy/dx
=−8x
⇒d2y/dx2
=−8
⇒d2y/dx2<0
Hence function has maximum value.
The parabolay=−4x2 opens in downward and has range {y∣y≥0,y∈R} and also has maximum value.
Pre Calculus 11 Mcgraw Hill Chapter 2.4 Solved Examples Page 157 Problem 18 Answer
Given :- The equation of the parabola isy=−0.2×2
To find :-State the direction of opening, whether it has a maximum or a minimum value, and the range.
First we will plot the graph by comparing the graph of the parabolay=x2
y=−0.2×2 has vertex at origin since it is in the form ofy=ax2 . It will open in downward direction since a=−0.2<0 and wider than the parabolay=x2 because−1<−0.2<1.
The required graph of parabola is shown below in red color.
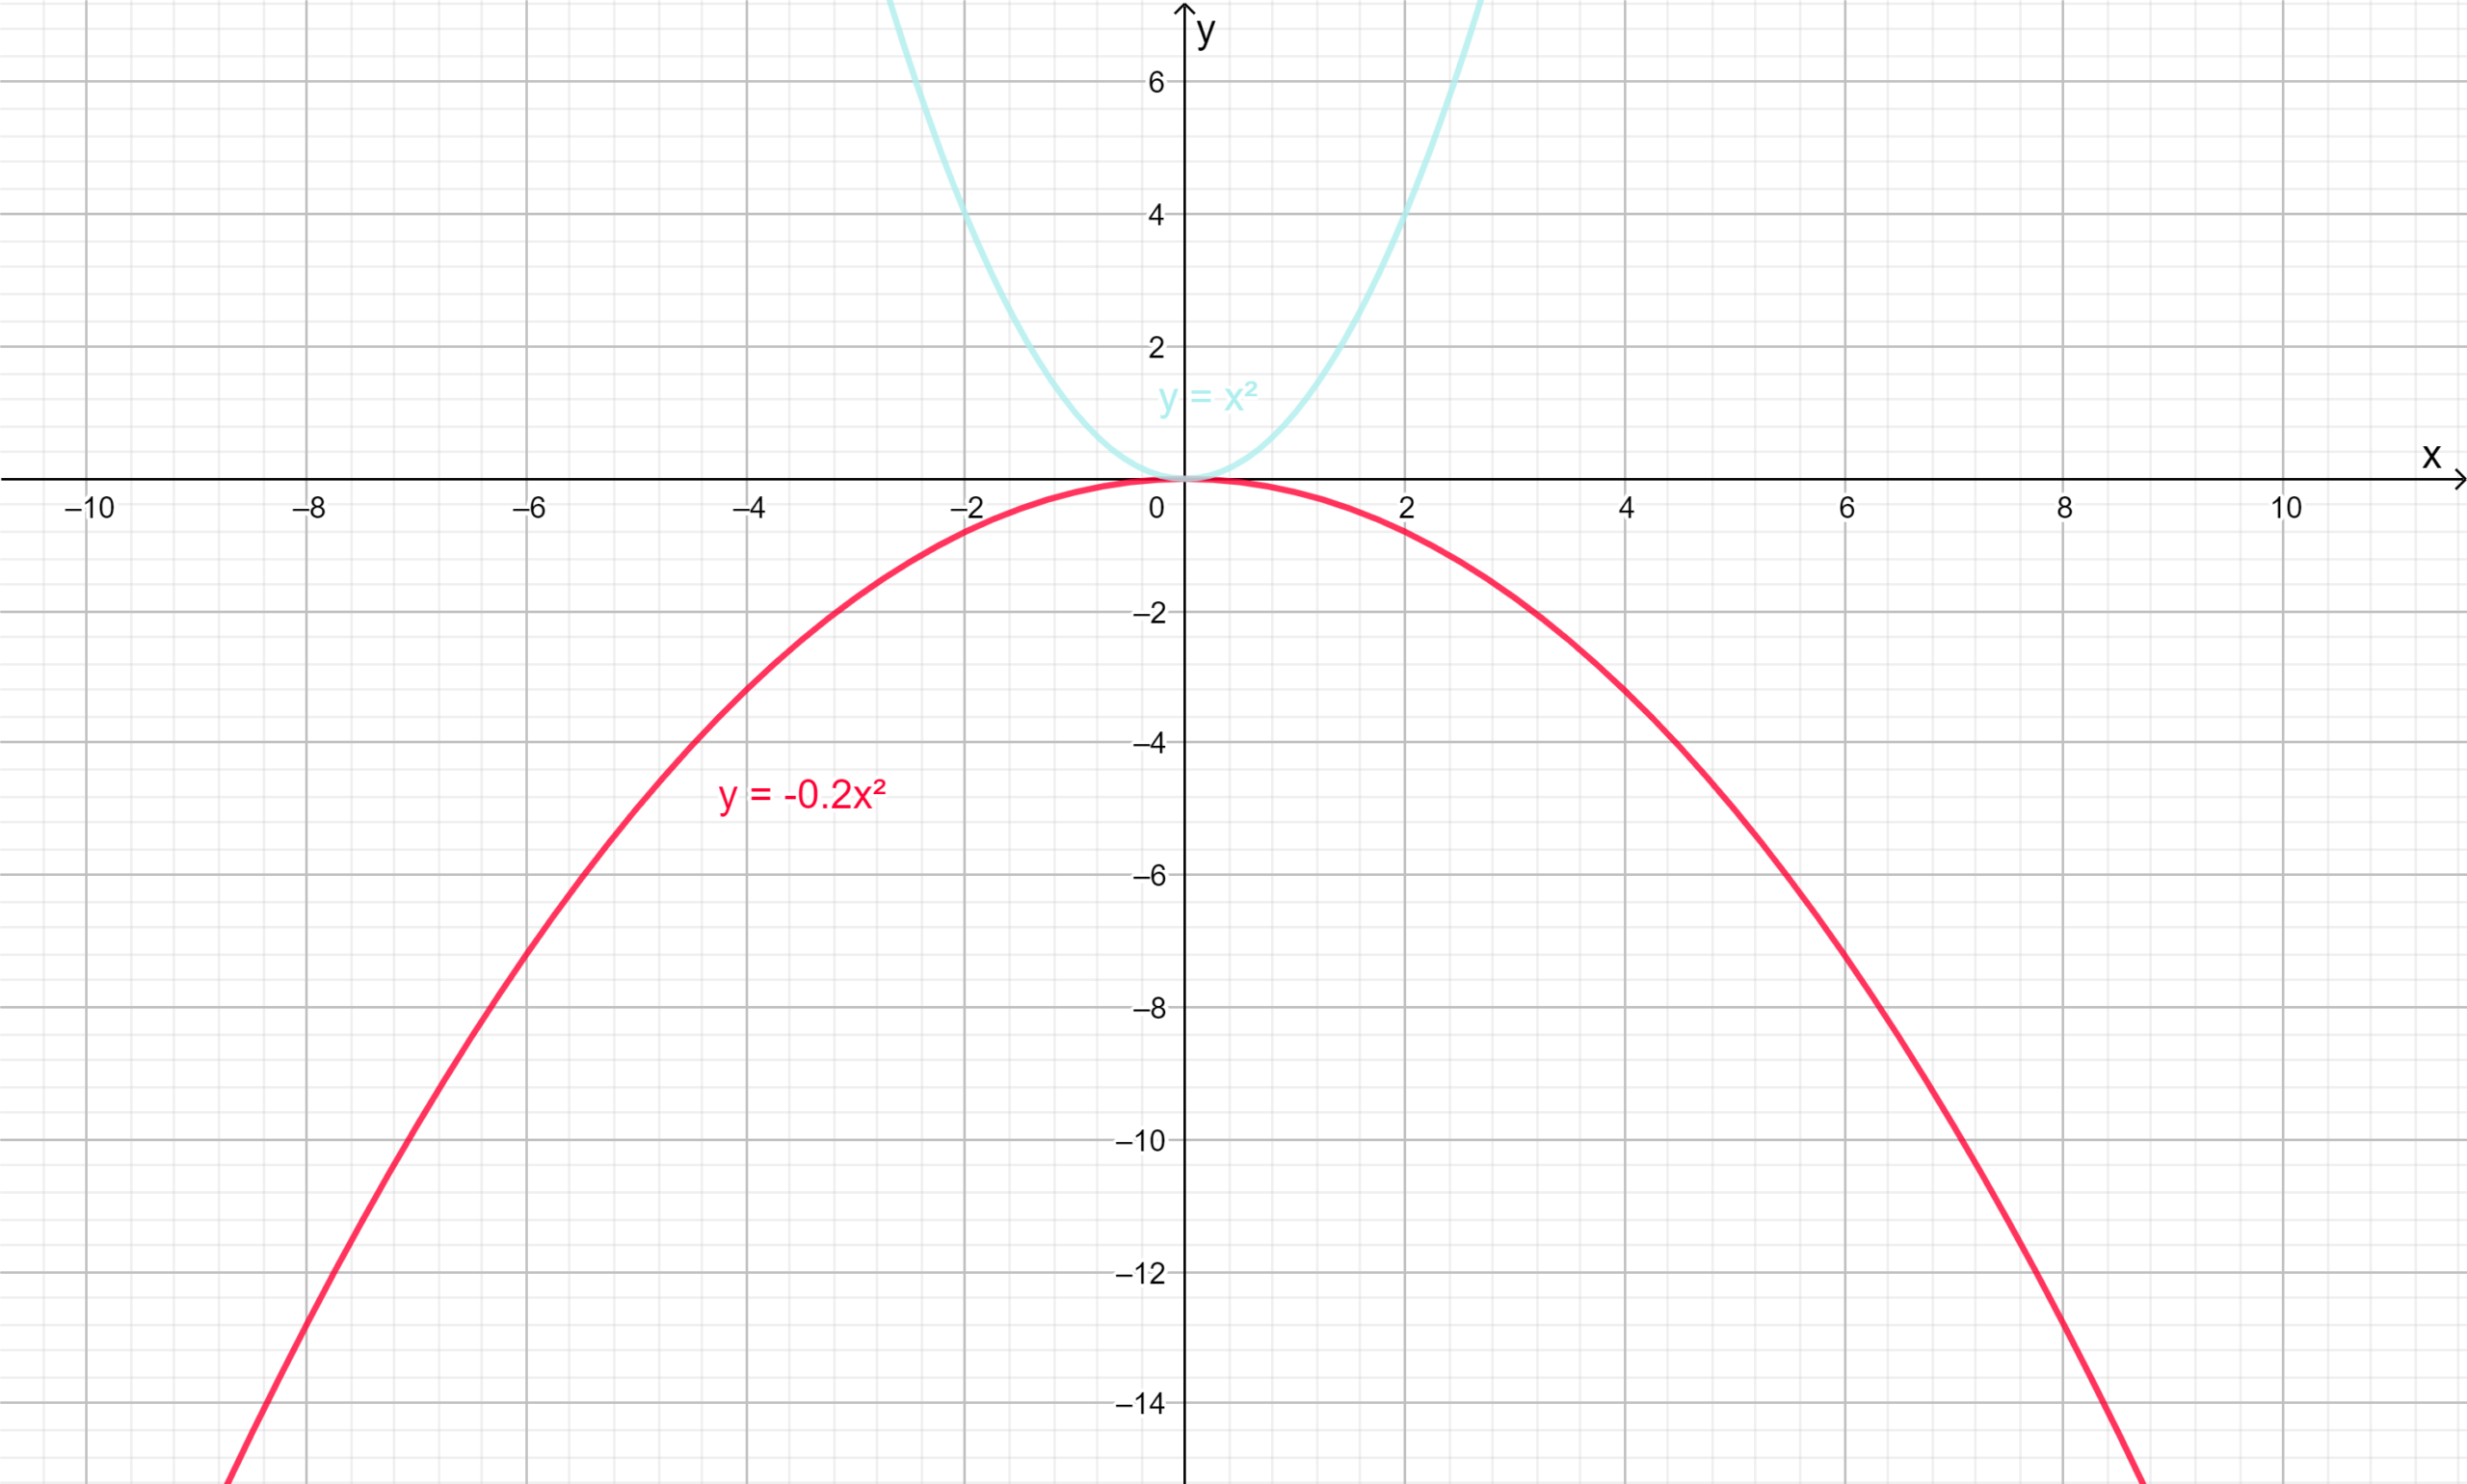
The range of the functiony=−0.2×2 is{y∣y≤0,y∈R}.
Take derivative of the function twice to determine whether it has maximum value or minimum value.
⇒dy/dx
=−0.4x
⇒d²y/dx²
=−0.4
⇒d²y/dx²<0
Hence function has maximum value.
F(x)=−0.2x2 which opens downward has range{y∣y≥0,y∈R} and also it has maximum value.
Pre Calculus 11 Chapter 2 Exercise 2.4 Trigonometry Detailed Solutions Page 157 Problem 19 Answer
Given :- The equations of the parabolas are y=x2,y=x2+1
To find :- The relation between given parabolas and sketch the graph of the second function in each pair, and determine the vertex, the equation of the axis of symmetry, the domain and range, and any intercepts.
As the coefficient of x2 is same in both the equation of parabola therefore second parabola i.e.y=x2+1 is as wide as first one.
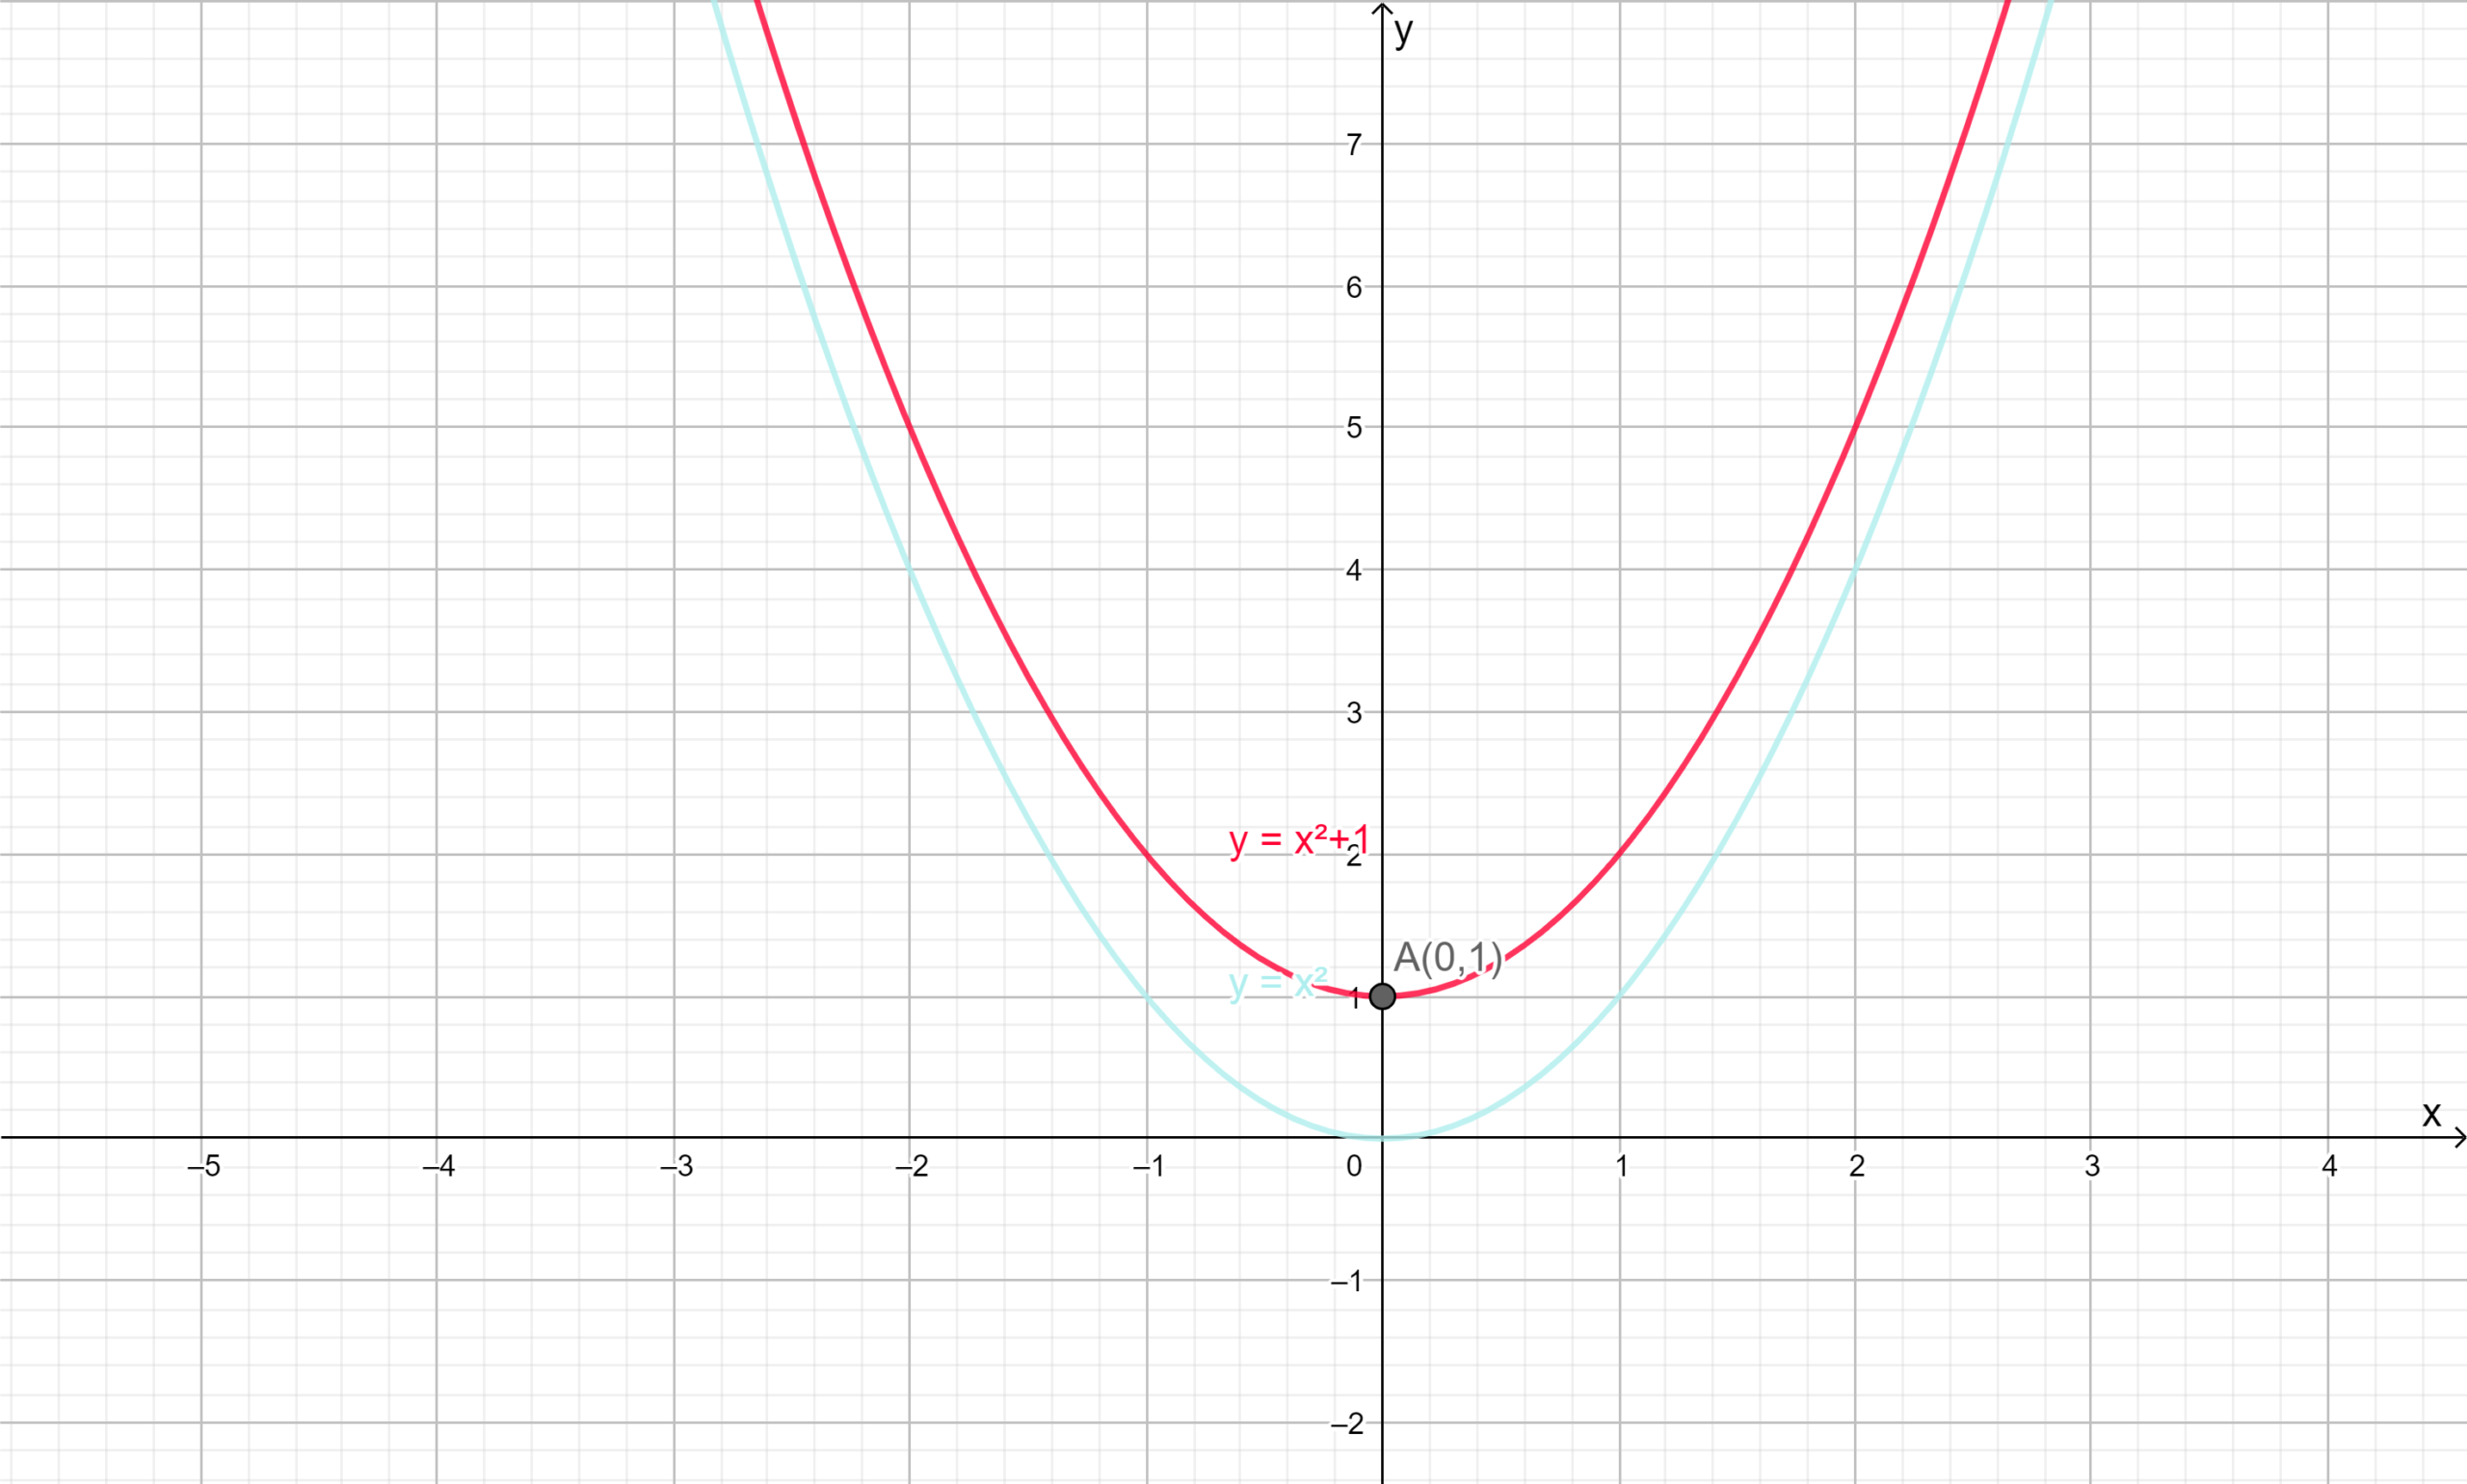
But it has different vertex which can be determined by comparing the standard equation we will get the vertex of the parabolay=x2+1 as(0,1) so the graph of second parabola can be get by shifting the first parabola upward ony−axis by 1 unit. as shown in figure.
This graph is symmetric about y-axis so the equation of axis of symmetry is x=0.
The domain of the function f(x)=x2+1 is{x∣−∞<x<∞,x∈R} and the range of the function is given by{y∣y≥1,y∈R}.
The y- intercept is calculated by putting x=0 iny=x2+1⇒y=1 and x-intercept is calculated by puttingy=0⇒x=√−1 which is imaginary so the second parabola does not cut x- axis.
The parabolay=x2+1 has vertex(0,1) ,y-intercept1unit,the domain of the parabola is{x∣−∞<x<∞,x∈R} and range is{y∣y≥1,y∈R} and the parabola is symmetric to the line x=0.
Pre Calculus 11 Chapter 2 Exercise 2.4 Trigonometry Detailed Solutions Page 157 Problem 20 Answer
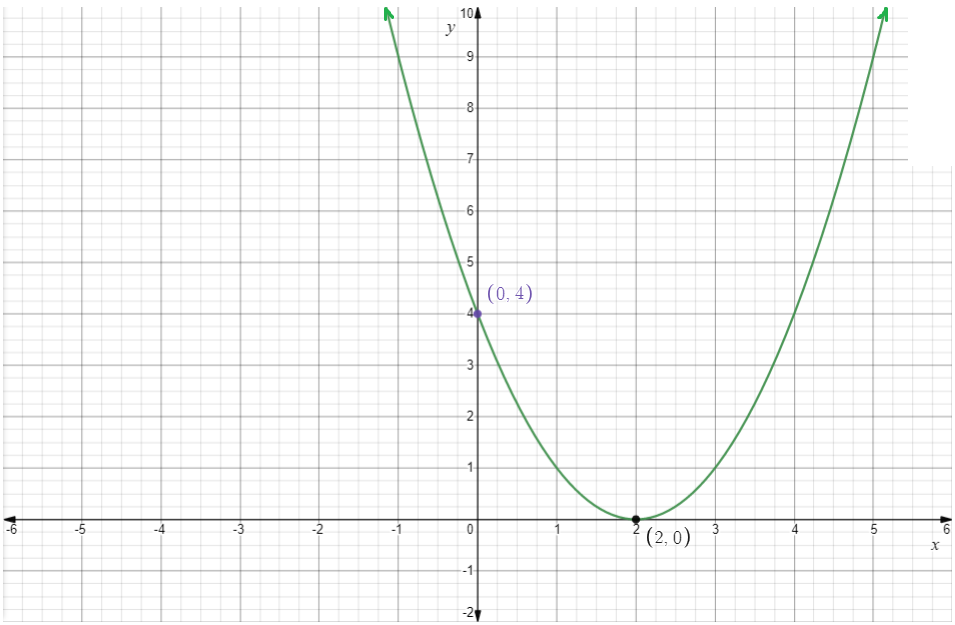
Given pair of functions is y=x2 andy=(x−2)2.
We need to describe the relation between the graphs of given functions and also to find the vertex, equation of axis of symmetry, the domain and range and the intercepts (if any) of the second function.
Comparey=(x−2)2 withy=(x−c)2 and then describe the relation between the graphs of given functions and then draw the graph of second function.
Comparey=(x−2)2 withy=(x−c)2, we get c=2.
Therefore the graph ofy=(x−2)2 is obtained by horizontally shifting the graph of y=x2 to the right side by2 units.
The graph ofy=(x−2)2 is,

The vertex is(2,0).
The equation of axis of symmetry is,
x=c
⇒x=2
The domain is the set of all real numbers.
The range is[0,∞).
x-intercept is 2 and y-intercept is 4.
The graph is,
The vertex is(2,0).
The equation of axis of symmetry is x=2.
The domain is the set of all real numbers.
The range is[0,∞).
x-intercept is 2 and y-intercept is 4.
Pre Calculus 11 Chapter 2 Exercise 2.4 Trigonometry Detailed SolutionsPage 157 Problem 21 Answer
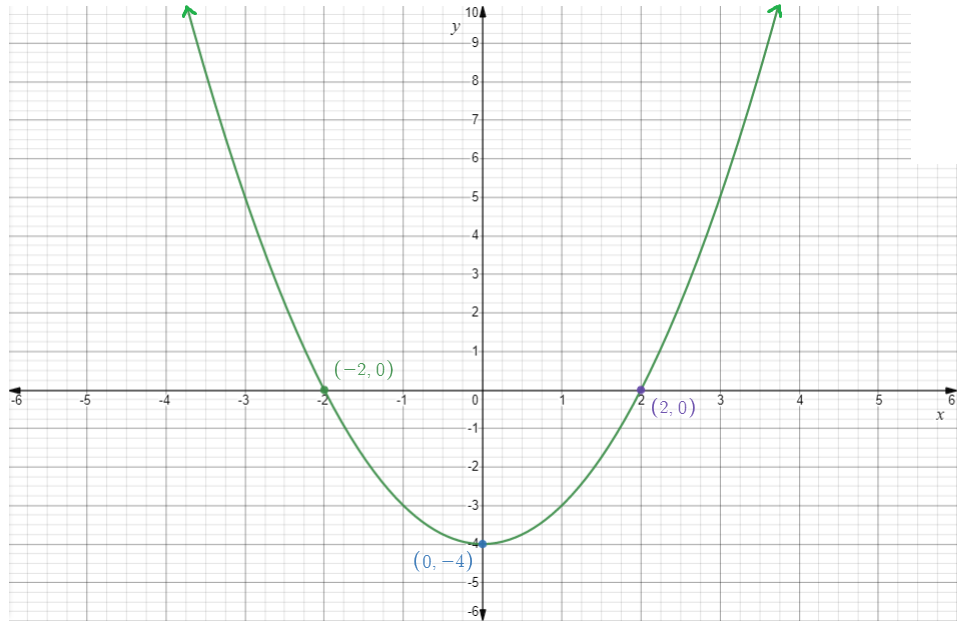
Given pair of functions is y=x2 and y=x2−4.
We need to describe the relation between the graphs of given functions and also to find the vertex, equation of axis of symmetry, the domain and range and the intercepts (if any) of the second function.
Comparey=x2−4 with y=x2−k and then describe the relation between the graphs of given functions and then draw the graph of second function.
Comparey=x2−4 with y=x2−k, we get k=4.
Therefore the graph ofy=x2−4 is obtained by vertically shifting the graph of y=x2 downward by 4 units.
Now the graph ofy=x2−4 is,

The vertex is(0,−4).
The equation of axis of symmetry isy-axis. That is,x=0.
The domain is the set of all real numbers.
The range is[−4,∞).
x-intercepts are−2,2 and y-intercept is−4.
The graph is,
The vertex is(0,−4).
The equation of axis of symmetry is x=0.
The domain is the set of all real numbers.
The range is[−4,∞).
x-intercepts are−2,2 and they-intercept is−4.
Pre Calculus 11 Chapter 2 Exercise 2.4 Trigonometry Detailed Solutions Page 157 Problem 22 Answer
Given pair of functions is y=x2 and y=(x+3)2.
We need to describe the relation between the graphs of given functions and also to find the vertex, equation of axis of symmetry, the domain and range and the intercepts (if any) of the second function.
Comparey=(x+3)2 with y=(x+c)2 and then describe the relation between the graphs of given functions and then draw the graph of second function.
Comparey=(x+3)2 withy=(x+c)2, we get
c=3.
Therefore the graph ofy=(x+3)2 is obtained by horizontally shifting the graph of y=x2 to the left side by 3 units.
Now the graph ofy=(x+3)2 is,
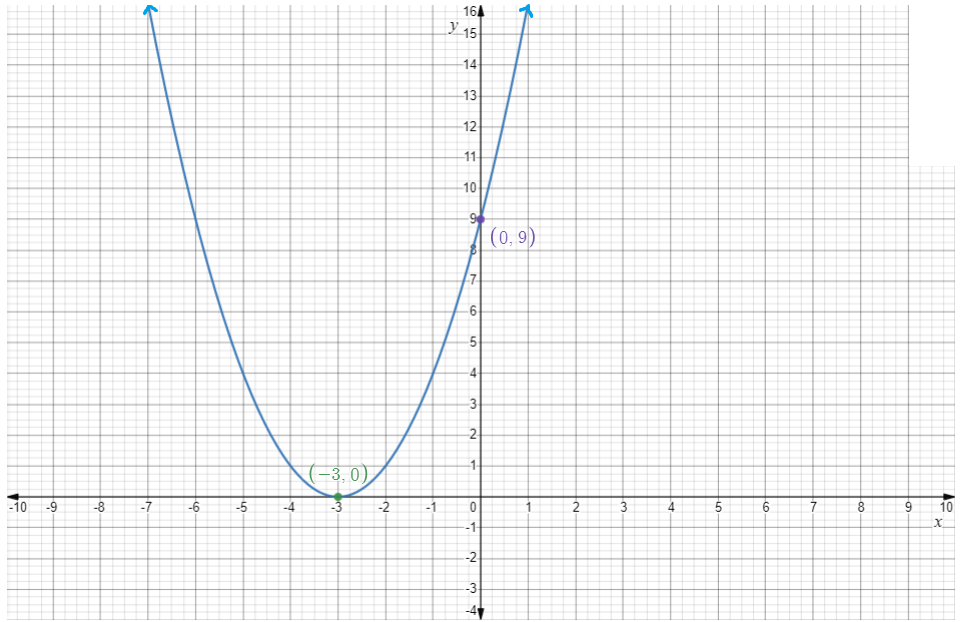
The vertex is(−3,0).
The equation of axis of symmetry is,
x=−c
⇒x=−3
The domain is the set of all real numbers.
The range is[0,∞).
x-intercept is−3 and y-intercept is 9.
The graph is,

The vertex is(−3,0).
The equation of axis of symmetry is x=−3.
The domain is the set of all real numbers.
The range is[0,∞).
x-intercept is−3 and y-intercept is 9.
Pre Calculus 11 Chapter 2 Exercise 2.4 Trigonometry Detailed Solutions Page 157 Problem 23 Answer
Given function is f(x)=(x+5)2+11.
We need to describe how to sketch the graph of the given function using transformations.
First consider the graph of f(x)=x2.
Now the graph of(x+5)2 can be obtained by horizontally shifting the graph of x2to the left side by 5 units.
Now the graph of f(x)=(x+5)2+11 can be obtained by vertically shifting the graph of(x+5)2 upward by11 units.
The graph off(x)=(x+5)2+11 can be obtained by horizontally shifting the graph off(x)=x2 to the left side by 5 units and then vertically shifting upward by 11 units.
Understanding Chapter 2 Exercise 2.4 Trigonometry In Pre Calculus Page 157 Problem 24 Answer
Given function isf(x)=−3×2−10.
We need to describe how to sketch the graph of the given function using transformations.
First consider the graph off(x)=x2.
Now the graph of−3×2 can be obtained by reflecting the graph of x2 in the x-axis and narrowing the graph by 3 units.
Now the graph off(x)=−3×2−10 can be obtained by vertically shifting the graph of−3×2 downward by 10 units.
The graph off(x)=−3×2−10 can be obtained by reflecting the graph of f(x)=x2 in the x-axis and narrowing the graph by 3 units and then vertically shifting down by 10 units.
Page 157 Problem 25 Answer
Given function isf(x)=5(x+20)2−21.
We need to describe how to sketch the graph of the given function using transformations.
First consider the graph off(x)=x2.
Now the graph of5(x+20)2 can be obtained by horizontally shifting the graph of x2 to the left side by20 units and then narrowing the graph by5 units.
Now the graph off(x)=5(x+20)2−21 can be obtained by vertically shifting the graph of 5(x+20)2 downward by 21 units.
The graph off(x)=5(x+20)2−21 can be obtained by horizontally shifting the graph of x2 to the left side by 20 units and then narrowing the graph by 5 units and then vertically shifting down by 21units.
Understanding Chapter 2 Exercise 2.4 Trigonometry in Pre Calculus Page 157 Problem 26 Answer
Given: f(x)=−1/8(x−5.6)2+13.8
To Describe how to sketch the graph of each function using transformations.
We have the function f(x)=−1/8(x−5.6)2+13.8
The graph of f(x)=−1/8(x−5.6)2+13.8 can be obtained from the graph of f(x)=−x2 by shifting the graph by a factor of 13.8 along the vertical direction also right shift by a factor of 1/8
So the graph of the equation is

Hence, the graph of the equation can be sketched by transformation as shift the graph by a factor of 13.8 along the vertical direction also right shift by a factor of 1/8 and the graph is
Page 157 Problem 27 Answer
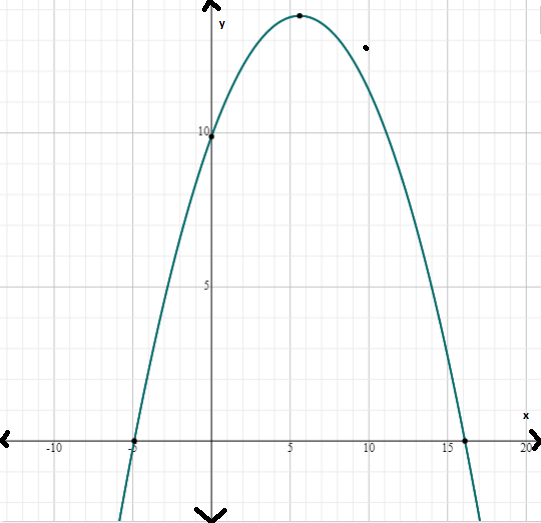
Given: a) y=−(x−3)2+9
To Sketch the graph of each function. Identify the vertex, the axis of symmetry, the direction of opening, the maximum or minimum value, the domain and range, and any intercepts.
We have the equation y=−(x−3)2+9
The graph of the function is

Vertex of the function is: Maximum (3,9)
Axis interception point of the function is X-intercept:(6,0),(0,0), Y-intercept:(0,0)
The direction of opening is downward
The domain of the function is (−∞,∞)
The Range of the function is (−∞,9)
Hence, the graph of the equation is
Vertex of the function is: Maximum (3,9)
Axis interception point of the function is X-intercept (6,0),(0,0), Y-intercept (0,0)
The direction of opening is downward
The domain of the function is (−∞,∞)
The Range of the function is (−∞,9)
Page 157 Problem 28 Answer
Given: y=0.25(x+4)2+1
To Sketch the graph of each function.
Identify the vertex, the axis of symmetry, the direction of opening, the maximum or minimum value, the domain and range, and any intercepts.
We have the function y=0.25(x+4)2+1
The graph of the function is
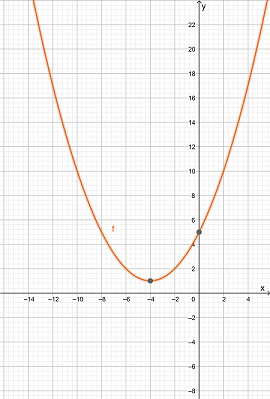
Vertex of the function is: Minimum (-4,1)
Axis interception point of the function is Y-intercept (0,5)
The direction of opening is upward
The domain of the function is (−∞,∞)
The Range of the function is [1,∞)
Hence, the graph of the function is

Vertex of the function is: Minimum (-4,1)
Axis interception point of the function is Y-intercept (0,5)
The direction of opening is upward
The domain of the function is (−∞,∞)
The Range of the function is [1,∞)
Page 157 Problem 29 Answer
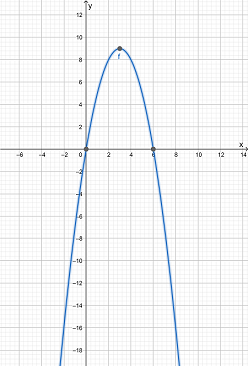
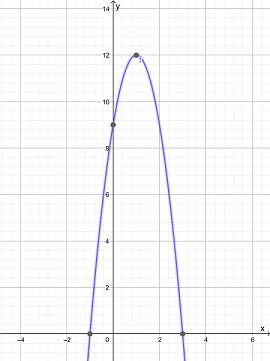
Given: y=−3(x−1)2+12
To Sketch the graph of each function.
Identify the vertex, the axis of symmetry, the direction of opening, the maximum or minimum value, the domain and range, and any intercepts.
We have the function y=−3(x−1)2+12
The graph of the function is

Vertex of the function is: Maximum (1,12)
Axis interception point of the function is X-intercept: (3,0),(-1,0), Y-intercept (0,9)
The direction of opening is downward
The domain of the function is (−∞,∞)
The Range of the function is (−∞,12]
Hence the graph of the equation is
Vertex of the function is: Maximum (1,12)
Axis interception point of the function is X-intercept: (3,0),(-1,0), Y-intercept (0,9)
The direction of opening is downward
The domain of the function is (−∞,∞)
The Range of the function is (−∞,12]
Page 157 Problem 30 Answer
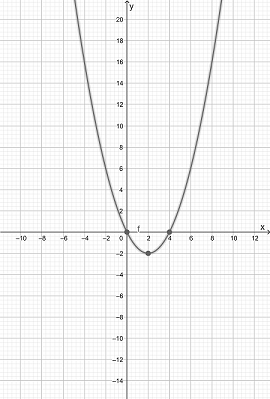
Given: y=1/2(x−2)2−2
To Sketch the graph of each function.
Identify the vertex, the axis of symmetry, the direction of opening, the maximum or minimum value, the domain and range, and any intercepts.
We have the function y=1/2(x−2)2−2
The graph of the function is

Vertex of the function is: Minimum (2,-2)
Axis interception point of the function is X-intercept: (4,0),(-1,0), Y-intercept (0,0)
The direction of opening is upward
The domain of the function is (−∞,∞)
The Range of the function is [−2,∞)
Hence, the graph of the function is
Vertex of the function is: Minimum (2,-2)
Axis interception point of the function is X-intercept: (4,0),(-1,0), Y-intercept (0,0) The direction of opening is upward
The domain of the function is (−∞,∞)
The Range of the function is [−2,∞)