
Probability and Statistics for Engineering and the Sciences 8th Edition Chapter 1 Overview and Descriptive Statistics
Page 43 Problem 1 Answer
Given ,Based on the study of the relationship between age and various visual functions (such as acuity and depth perception) reported the following observations on the area of scleral lamina from human optic nerve heads (“Morphometry of Nerve Fiber Bundle Pores in the Optic Nerve Head of the Human”).
The following data is provided:
⇒ 2.75,2.62,2.74,3.85,2.34,2.74,3.93,4.21,3.88,4.33,3.46,4.52,2.43,3.65,2.78,3.56,3.01
We have to calculate i∑xi and i∑x2i
To calculate i∑xi we find
⇒ 2.75+2.62+2.74+3.85+2.34+2.74+3.93+4.21+3.88+4.33+3.46+4.52+2.43+3.65+2.78+3.56+3.01
⇒ 2.75+2.62+2.74+3.85+2.34+2.74+3.93+4.21+3.88+4.33+3.46+4.52+2.43+3.65+2.78+3.56+3.01=56.8
Hence i∑xi=56.8
To calculate i∑x2i
we find 2.752+2.622+2.742+3.852+2.342+2.742+3.932+4.212+3.882+4.332+3.462+4.522+2.432+3.652+2.782+3.562+3.012
⇒ 2.752+2.622+2.742+3.852+2.342+2.742+3.932+4.212+3.882+4.332+3.462+4.522+2.432+3.652+2.782+3.562+3.012=197.804
Hence i∑xi2=197.804
So,based on the study of the relationship between age and various visual functions (such as acuity and depth perception) reported the following observations on the area of scleral lamina from human optic nerve heads then the values as follows:
∑ixi=56.8 and ∑ixi2=197.804
Page 43 Problem 2 Answer
Given, Based on the study of the relationship between age and various visual functions (such as acuity and depth perception) reported the following observations on the area of scleral lamina from human optic nerve heads (“Morphometry of Nerve Fiber Bundle Pores in the Optic Nerve Head of the Human”.
The given data is: 2.75, 2.62, 2.74, 3.85, 2.34, 2.74, 3.93,4.21, 3.88, 4.33, 3.46, 4.52, 2.43, 3.65, 2.78, 3.56,3.01.
we need to find the sample variance using the formula.
First we have to calculate the standard deviation using sample variance.
To find s2 we calculate s2= i∑xi2−(∑ixi)2/n
Since i∑xi=56.8 therefore,(∑xi)2/n
=(56.8)/2
⇒ 17(∑xi)2/n
=189.779
Also since i∑xi2=197.804
We have s{2}=197.804−189.779
The sample variance s{2}=8.025
To find standard deviation we s see
s=(8.025)1/2
s=2.8329
The standard deviation s=2.8329
Hence, based on study of the relationship between age and various visual functions (such as acuity and depth perception) reported the following observations on the area of scleral lamina from human optic nerve heads determined as follows:
sample variance s{2}=8.025 and the standard deviation s=2.8329 .
Probability And Statistics For Engineering 8th Edition Solutions Exercise 1.4 Page 44 Problem 3 Answer
Given, Based on the article “A Thin-Film Oxygen Uptake Test for the Evaluation of Automotive Crankcase Lubricants” the data as follows:
Set of data is 87103130160180195132145211105145153152138879993119129.
We need to find the sample variance and standard deviation.
To find sample variance we calculate s2=i∑xi2−(∑ixi)2/n
Since ∑ixi=87+103+130+160+180+195+132+145+211+105+145+153+152+138+87+99+93+119+125+129
∑ixi=2563
Therefore,
(∑xi)2/n=(2563)2/19
(∑xi)2/n=345735.2105
Also∑ixi2=872
+1032+1302+1602+1802+1952+1322+1452+2112+1052+1452+1532+1522+1382+872+992+932+1192+1252+1292
∑ixi2=368501
So we have s{2}=368501−345735.2105
s{2}=22765.7895
The sample variance
s{2}=22765.7895
To find the standard deviations use s=√s2
The standard deviation s=150.8834
Hence, based on the article “A Thin-Film Oxygen Uptake Test for the Evaluation of Automotive Crankcase Lubricants” is determined as follows:
sample variance is s{2} =22765.7895 and
standard deviation is s=150.8834.
Page 44 Problem 4 Answer
Given,
The given data set is: 87 103 130 160 180 195 132 145 211 105 145 153 152 138 879 993 119 129
We need to find the sample variance and sample standard deviation when observations were re-expressed in hours without actually performing the reexpression.
Since in the re expression minutes are changed into hours the observations xi are now xi/60
Hence the new sample variance s1
2=i∑(xi/60)2−(∑ixi/60)2/n
∑i(xI/60)2−(∑ixi/60)2/n
=∑ixi2−{∑xi2/n
⇒ 3600
s12=s2/3600
The new sample variance s{1}{2}=6.3238.
To find the new standard deviation s1 use s1=√s12
s{1}=2.514722
The new standard deviation s{1}=2.514722
Hence,based on the article “A Thin-Film Oxygen Uptake Test for the Evaluation of Automotive Crankcase Lubricants”from the following data we get:
new sample variance s{1}{2}=6.3238 and new standard deviation s1=2.514722.
Page 44 Problem 5 Answer
Given, Based on the article “Investigation of Grip Force, Normal Force, Contact Area, Hand Size, and Handle Size for Cylindrical Handles”included the following data on grip strength (N) for a sample of 42 individuals:
The given data set is :
⇒ 161 81 82 63 341 54 566 668 879 19 59 810 610 911 111 812 712 713 514 514 714 915 1168
⇒ 172 183 189 190 200 210 220 229 230 233 238 244 259 294 329 403
we need to construct a stem-and-leaf display based on repeating each stem value twice.
To construct a stem-and-leaf display we take the hundreds digit as the stem and tens and ones digits as the leaf.
We repeat each stem value twice by adding L to the stem with leaves from 00 to 49 and H to the stem with leaves from to.
| Stem | Leaves |
| OL | 16 18 18 26 33 41 |
| OH | 54 56 66 68 87 91 95 98 |
| 1L | 06 09 11 18 27 27 35 45 47 49 |
| 1H | 51 68 72 83 89 90 |
| 2L | 00 10 20 29 30 33 38 44 |
| 2H | 59 54 |
| 3L | 29 |
| 3H | |
| 4L | 3 |
Comment on interesting feature :
Most data are grouped in the 1L leaf. The largest sample value,403 is very far from the bulk of the data. It seems to be an outlier.
Hence,based on the article “Investigation of Grip Force, Normal Force, Contact Area, Hand Size, and Handle Size for Cylindrical Handles”
most data is grouped in 1L leaf and the largest sample value is 403 which seems to be outlier.
Chapter 1 Exercise 1.4 overview And Descriptive Statistics Solved Examples Page 44 Problem 6 Answer
Given, Based on the article “Investigation of Grip Force, Normal Force, Contact Area, Hand Size, and Handle Size for Cylindrical Handles”included the following data on grip strength (N) for a sample of 42 individuals:
The given dataset is:
⇒ 161 818 263 341 545 666 688 791 95 98 106 109 111 118 127 127 135 145 147 149 151 168
⇒ 172 183 189 190 200 210 220 229 230 233 238 244 259 294 329 403
We need to find the values of the fourths and the fourth spread.
First segregate the data into two classes larger half and smaller half
The smaller half of the data set is
16,18,18,26,33,41,54,56,66,68,87,91,95,98,106,109,111,118,127,127,135
There are 21 observations hence the median is the 11th observation hence
The larger half of the data set is
145,147,149,151,168,172,183,189,190,200,210,220,229,230,233,238,244,259,294,329,403
There are 21 observations hence the median is the11th
observation hence upper fourth =210 Fourth spread fs
given by fs= upper fourth − lower fourth
fs=210−87
fs=123
Hence the Fourth spread fs=123
Therefore,based on the article “Investigation of Grip Force, Normal Force, Contact Area, Hand Size, and Handle Size for Cylindrical Handles” included the
following data on grip strength (N) for a sample of 42 individuals the values of the fourths and the fourth spread obtained as follows:
The Fourth spread fs=123
Page 44 Problem 7 Answer
Given, Based on the article “Investigation of Grip Force, Normal Force, Contact Area, Hand Size, and Handle Size for Cylindrical Handles”included the following data on grip strength (N) for a sample of 42 individuals:
The given dataset is :
⇒ 161 818 263 341 545 666 688 791 95 98 106 109 111 118 127 127 135 145 147 149 151 168 172 183 189 190 200 210 220 229 230 233 238 244 259 294 3294 03
we need to construct a box plot.
The box plot for the data
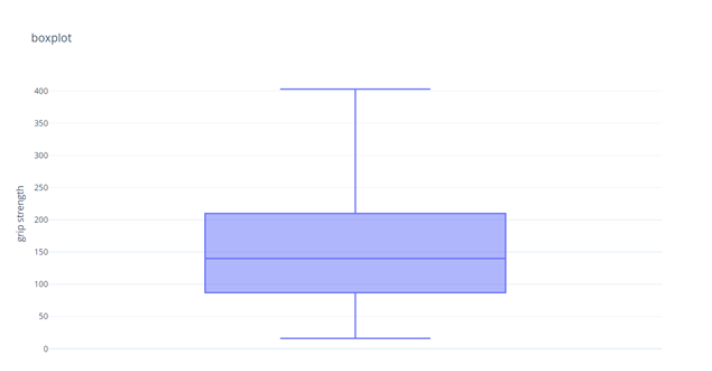
There is slight positive skew of the data.
The variability is rather big and there is one outlier on the upper end, 403.
Hence, based on the article “Investigation of Grip Force, Normal Force, Contact Area, Hand Size, and Handle Size for Cylindrical Handles”included the following data on grip strength (N) for a sample of 42 individuals:
The boxplot is a better representation of the data is as follows:

Comment : There is slight positive skew of the data and the variability is rather big and there is one outlier on the upper end, 403.
Page 44 Problem 8 Answer
Given, Based on the article “Investigation of Grip Force, Normal Force, Contact Area, Hand Size, and Handle Size for Cylindrical Handles” included the following data on grip strength (N) for a sample of 42 individuals:
The given dataset is :
⇒ 16 18 18 26 33 41 545 666 688 791 95 98 106 109 111 118 127 127 135 145 147 149
⇒ 151 168 172 183 189 190 200 210 220 229 230 233 238 244 259 294 329 403
We need to find if there is any outlier or extreme outlier.
Now, lower fourth =87 upper fourth =210
Since Fourth spread fs given by fs= upper fourth − lower fourth
fs=210−87
fs=123
Hence the Fourth spread fs=123
An element is an outliner if it is less than 87−1.5fs or greater than 210+1.5fs
Since there are no negative data so an element is an outliner if it is greater than 394.5
The element 403 is an outlier.
An element is an extreme outliner if it is less than 87−3fs or greater than 210+3f
Since there are no negative data so an element is an extreme outliner if it is greater than 579.
There are no elements greater than 579 hence there are no extreme outlier.
So,based on the article “Investigation of Grip Force, Normal Force, Contact Area, Hand Size, and Handle Size for Cylindrical Handles” included the following
data on grip strength (N) for a sample of 42 individuals the element 403 is an outlier there are no extreme outlier.
Chapter 1 Exercise 1.4 Probability And Statistics Study Guide Page 44 Problem 9 Answer
Given, Based on the article “Investigation of Grip Force, Normal Force, Contact Area, Hand Size, and Handle Size for Cylindrical Handles” included the following data on grip strength (N) for a sample of 42 individuals:
The given dataset is:
⇒ 161 818 263 341 545 666 688 791 959 810 610 911 111 812 712 713 514 514 714 915 116 817 218 318 919 0200 210 220 229 230 233 238 244 259 294 329 403
We need to find by how much could the observation 403, currently the largest, be decreased without affecting fs.
lower fourth =87 upper fourth=210
Since Fourth spread fs= upper fourth − lower fourth
fs=210−87
fs=123
Since the fourth spread f{s}=123
So to effect the fourth spread either the upper fourth should change or the lower fourth
should change since the largest element 403 is closer to upper fourth so to change the upper fourth
The observation should become less than the upper fourth
so for 403 to become less than 210 it should be reduced at least by 194.
Hence the largest element 403 can be decreased by 193 without changing the fourth spread.
Therefore,based on the article “Investigation of Grip Force, Normal Force, Contact Area, Hand Size, and Handle Size for Cylindrical Handles” included the following data on grip strength (N) for a sample of 42 individuals then the largest element 403 can be decreased by 193 without changing the fourth spread.